
Executive summary
UK Research and Innovation (UKRI) invested over £9.1 billion in the UK’s research and innovation system in the 2023 to 2024 financial year. This is up from £8.4 billion in 2022 to 2023 and £7.8 billion in 2021 to 2022.
All regions and nations received an increase in UKRI investment between the financial years 2021 to 2022 and 2023 to 2024.
The greatest absolute increases in investment were seen in the North West, West Midlands and East Midlands. The greatest proportional increases were seen in Northern Ireland, the East Midlands and North West.
Increases in investment coincided with a period of high inflation between the financial years 2021 to 2022 and 2023 to 2024, during which time the cumulative rise in prices was about 13%.
The percentage of UKRI funding invested outside London, the South East and East of England, collectively known as the ‘Greater South East’, rose to 50% in 2023 to 2024. This is up from 49% in the 2022 to 2023 financial year and 47% in the 2021 to 2022 financial year. This represents a cumulative additional £1.4 billion invested outside the Greater South East since the 2021 to 2022 financial year.
In both the financial years 2022 to 2023 and 2023 to 2024, 91% of UKRI funding was invested in England, 6% in Scotland, 2% in Wales, and 1% in Northern Ireland.
Excluding Research England, these percentages become:
- 87% invested in England
- 9% in Scotland
- 3% in Wales
- 1% in Northern Ireland
Background
The UK government has set out its ambition to tackle regional disparities in the UK. Research and innovation is one of the means through which the government seeks to boost productivity, wages, jobs and living standards across the country.
Our annual reports and accounts show that in the 2022 to 2023 and 2023 to 2024 financial years (6 April 2022 to 5 April 2024), UKRI invested a combined £17 billion across the UK.
This report sets out where we invested our funding in the financial years 2022 to 2023 and 2023 to 2024, and how the geographical distribution of our investment has changed since the 2021 to 2022 financial year.
Findings
UKRI invested £8.4 billion in the UK’s research and innovation system in the 2022 to 2023 financial year, an 8% increase on the previous year’s £7.8 billion. In 2023 to 2024, we invested over £9.1 billion, a further 9% increase year-on-year and an 18% rise compared to 2021 to 2022.
The period covered by this report coincides with two years of high inflation in the UK, during which the cumulative rise in prices was approximately 13%. The data in this report is presented in nominal terms and does not account for the effects of inflation in reducing purchasing power over time.
UKRI investment outside the Greater South East
Figure 1: UKRI investment within and outside the Greater South East, financial years 2021 to 2022, 2022 to 2023 and 2023 to 2024
Source: UKRI financial accounting data
Download the data for figure 1 (ODS, 4KB)
Description of figure 1
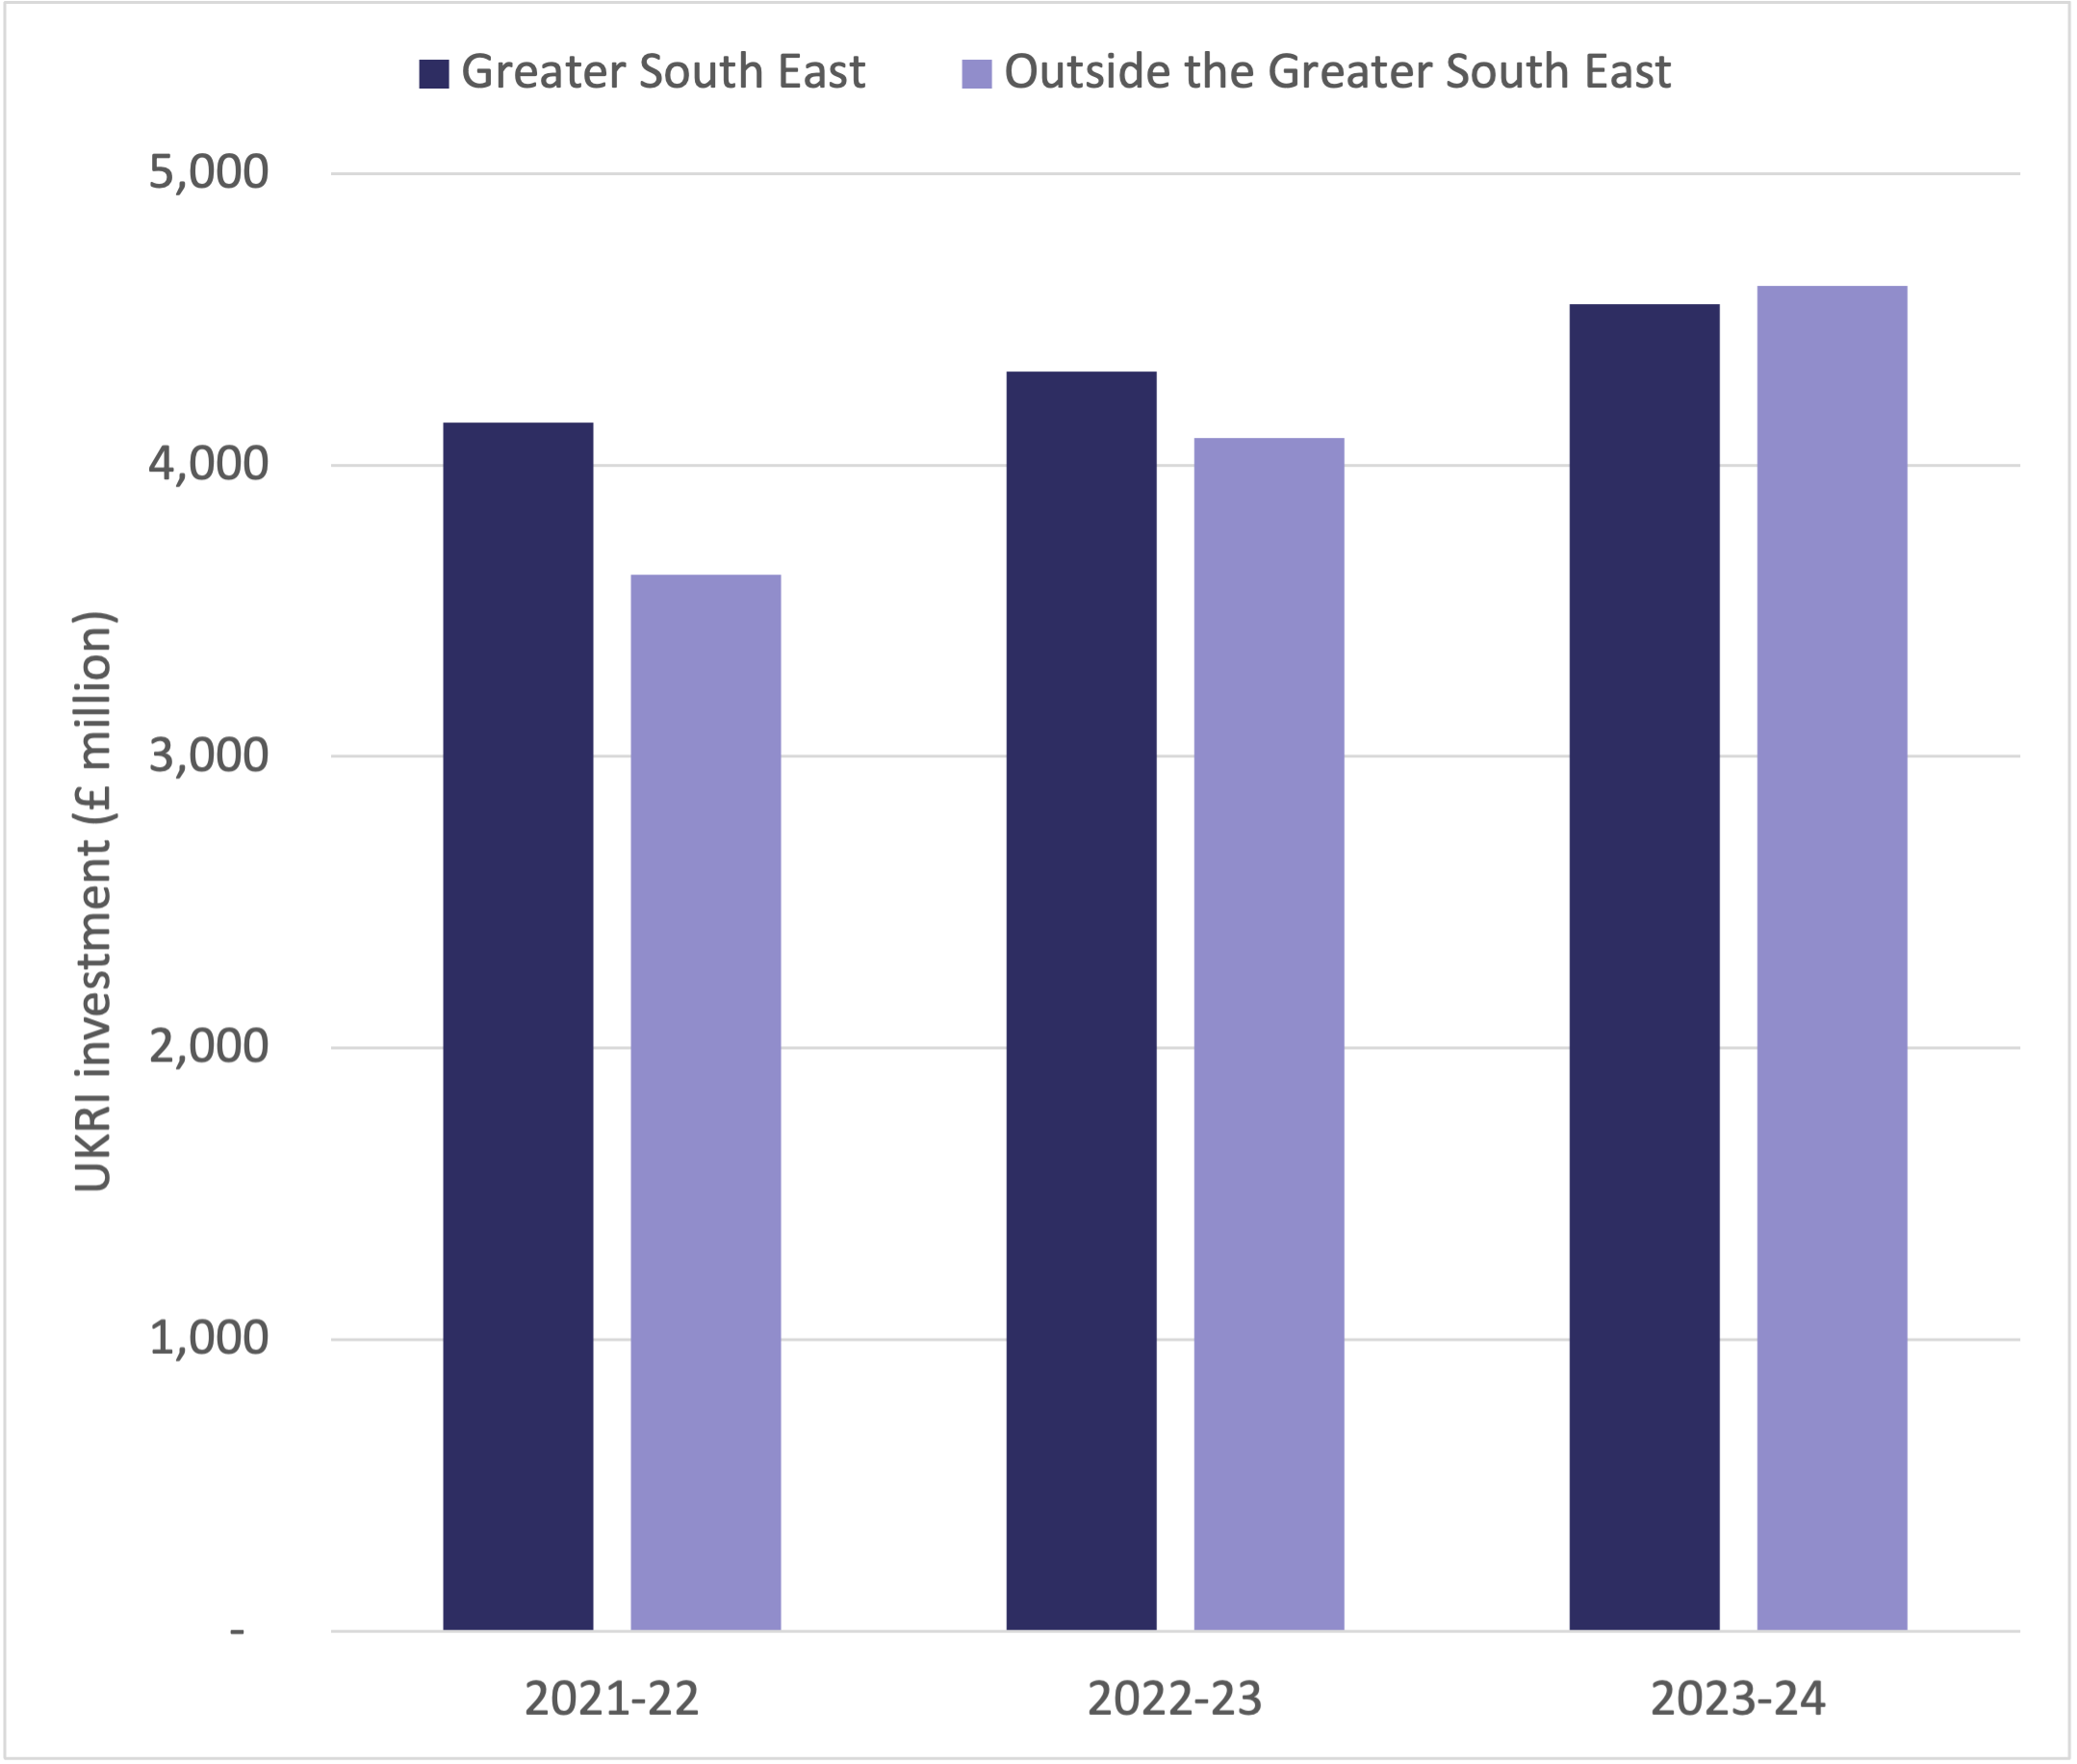
This figure shows the distribution of total UKRI investment in the UK within and outside the Greater South East in financial years 2021 to 2022, 2022 to 2023 and 2023 to 2024, in millions of pounds.
In the 2023 to 2024 financial year, UKRI invested more outside the Greater South East than within the Greater South East for the first time since we began publishing the geographical distribution of our funding using the current methodology.
We invested £4,550 million across London, the South East and East of England in the 2023 to 2024 financial year, compared to £4,614 million across the rest of the country.
This has increased the proportion of UKRI funding invested outside of London, the South East and East of England from 47% in the 2021 to 2022 financial year to 50% in the 2023 to 2024 financial year.
The percentage increase between the financial years 2021 to 2022 and 2023 to 2024 in funding outside of London, the South East and East of England (27% over the period) has been higher than the percentage increase in funding in the same regions (10%). Relative to the 2021 to 2022 financial year levels, UKRI invested a cumulative additional £1.4 billion outside the Greater South East in the financial years 2022 to 2023 and 2023 to 2024.
Table 1: UKRI investment per person within and outside the Greater South East, financial years 2021 to 2022, 2022 to 2023 and 2023 to 2024
| Area | 2021-22 | 2022-23 | 2023-24 |
|---|---|---|---|
| Greater South East | £170 | £175 | £183 |
| Outside the Greater South East | £85 | £95 | £106 |
Download the data for table 1 (ODS, 4KB)
UKRI investment per person increased from the 2021 to 2022 financial year to the 2023 to 2024 financial year within and outside the Greater South East, driven by UKRI investment increasing more quickly than population growth in these regions over the period.
UKRI investment per person is consistently higher within the Greater South East than outside the Greater South East, falling from a ratio of 2 to 1 to a ratio of 1.7 to 1 over the period.
For context, the combined population of London, the South East and East of England is about 25 million compared to 44 million in the rest of the UK.
Table 2: UKRI investment as a percentage of local gross value added (GVA) within and outside the Greater South East, financial years 2021 to 2022, 2022 to 2023 and 2023 to 2024
| Area | 2021-22 | 2022-23 | 2023-24 |
|---|---|---|---|
| Greater South East | 0.46% | 0.46% | 0.48% |
| Outside the Greater South East | 0.35% | 0.38% | 0.43% |
Notes for table 2: 2022 GVA data is used for both the financial years 2022 to 2023 and 2023 to 2024 as the most recent published data from the Office for National Statistics.
Download the data for table 2 (ODS, 4KB)
UKRI investment as a percentage of local economic activity increased by 0.02 percentage points for the Greater South East from the 2021 to 2022 financial year to the 2023 to 2024 financial year, and by 0.13 percentage points outside the Greater South East over the same period.
The difference between UKRI investment as a percentage of local GVA in the Greater South East compared to outside the Greater South East halved between the 2021 to 2022 financial year and the 2023 to 2024 financial year, from 0.11% to 0.05%.
UKRI investment by nation
Table 3: UKRI investment by nation, financial years 2021 to 2022, 2022 to 2023 and 2023 to 2024
| Nation | 2021-22 (£ million) | 2022-23 (£ million) | 2023-24 (£ million) |
|---|---|---|---|
| England | 7,102 | 7,681 | 8,357 |
| Scotland | 467 | 507 | 552 |
| Wales | 137 | 143 | 168 |
| Northern Ireland | 61 | 83 | 87 |
| UK total | 7,767 | 8,415 | 9,164 |
Download the data for table 3 (ODS, 4KB)
Table 4: research councils, Innovate UK and cross-UKRI investment by nation, financial years 2021 to 2022, 2022 to 2023 and 2023 to 2024
| Nation | 2021-22 (£ million) | 2022-23 (£ million) | 2023-24 (£ million) |
|---|---|---|---|
| England | 4,613 | 4,722 | 5,344 |
| Scotland | 467 | 507 | 552 |
| Wales | 137 | 143 | 168 |
| Northern Ireland | 61 | 83 | 87 |
| UK total | 5,278 | 5,455 | 6,152 |
Download the data for table 4 (ODS, 4KB)
Tables 3 and 4 show the distribution of total UKRI investment and the distribution of research councils, Innovate UK and cross-UKRI investment (in other words, UKRI investment excluding Research England) in financial years 2021 to 2022, 2022 to 2023 and 2023 to 2024 in different UK nations, in millions of pounds.
In the 2023 to 2024 financial year the percentages of UKRI funding invested in each nation were:
- 91% England
- 6% in Scotland
- 2% in Wales
- 1% in Northern Ireland
Excluding Research England reduces the percentage invested in England to 87% and increases the percentages invested in Scotland to 9% and Wales to 3%.
These proportions have been stable over time. Since total funding has increased, all nations have experienced roughly similar rates of funding growth between the 2021 to 2022 financial year and the 2023 to 2024 financial year.
Table 5: UKRI investment per person by nation, financial years 2021 to 2022, 2022 to 2023 and 2023 to 2024
| Nation | 2021-22 | 2022-23 | 2023-24 |
|---|---|---|---|
| England | £126 | £134 | £145 |
| Scotland | £85 | £93 | £101 |
| Wales | £44 | £46 | £53 |
| Northern Ireland | £32 | £43 | £45 |
| UK total | £116 | £124 | £134 |
Download the data for table 5 (ODS, 4KB)
Table 6: UKRI investment as a percentage of local GVA by nation, financial years 2021 to 2022, 2022 to 2023 and 2023 to 2024
| Nation | 2021-22 | 2022-23 | 2023-24 |
|---|---|---|---|
| England | 0.42% | 0.44% | 0.48% |
| Scotland | 0.33% | 0.34% | 0.37% |
| Wales | 0.21% | 0.21% | 0.25% |
| Northern Ireland | 0.14% | 0.19% | 0.20% |
| UK total | 0.40% | 0.42% | 0.45% |
Download the data for table 6 (ODS, 4KB)
Tables 5 and 6 show the distribution of UKRI investment in financial years 2021 to 2022, 2022 to 2023 and 2023 to 2024 in different UK nations, adjusted for population and local economic activity.
All nations experienced increases in UKRI investment per person and as a percentage of local GVA from the 2021 to 2022 financial year to the 2023 to 2024 financial year, with the UK average increasing from £116 per person to £134, and 0.40% of UK GVA to 0.45%.
UKRI investment per person and as a percentage of local GVA is consistently higher in England than the devolved nations, though the relative differences between nations have decreased over the period.
UKRI investment by UK International Territorial Level 1 (ITL1) area
Figure 2: UKRI investment by ITL1 area, financial years 2021 to 2022, 2022 to 2023 and 2023 to 2024
Source: UKRI financial accounting data
Download the data for figure 2 (ODS, 4KB)
Description of figure 2
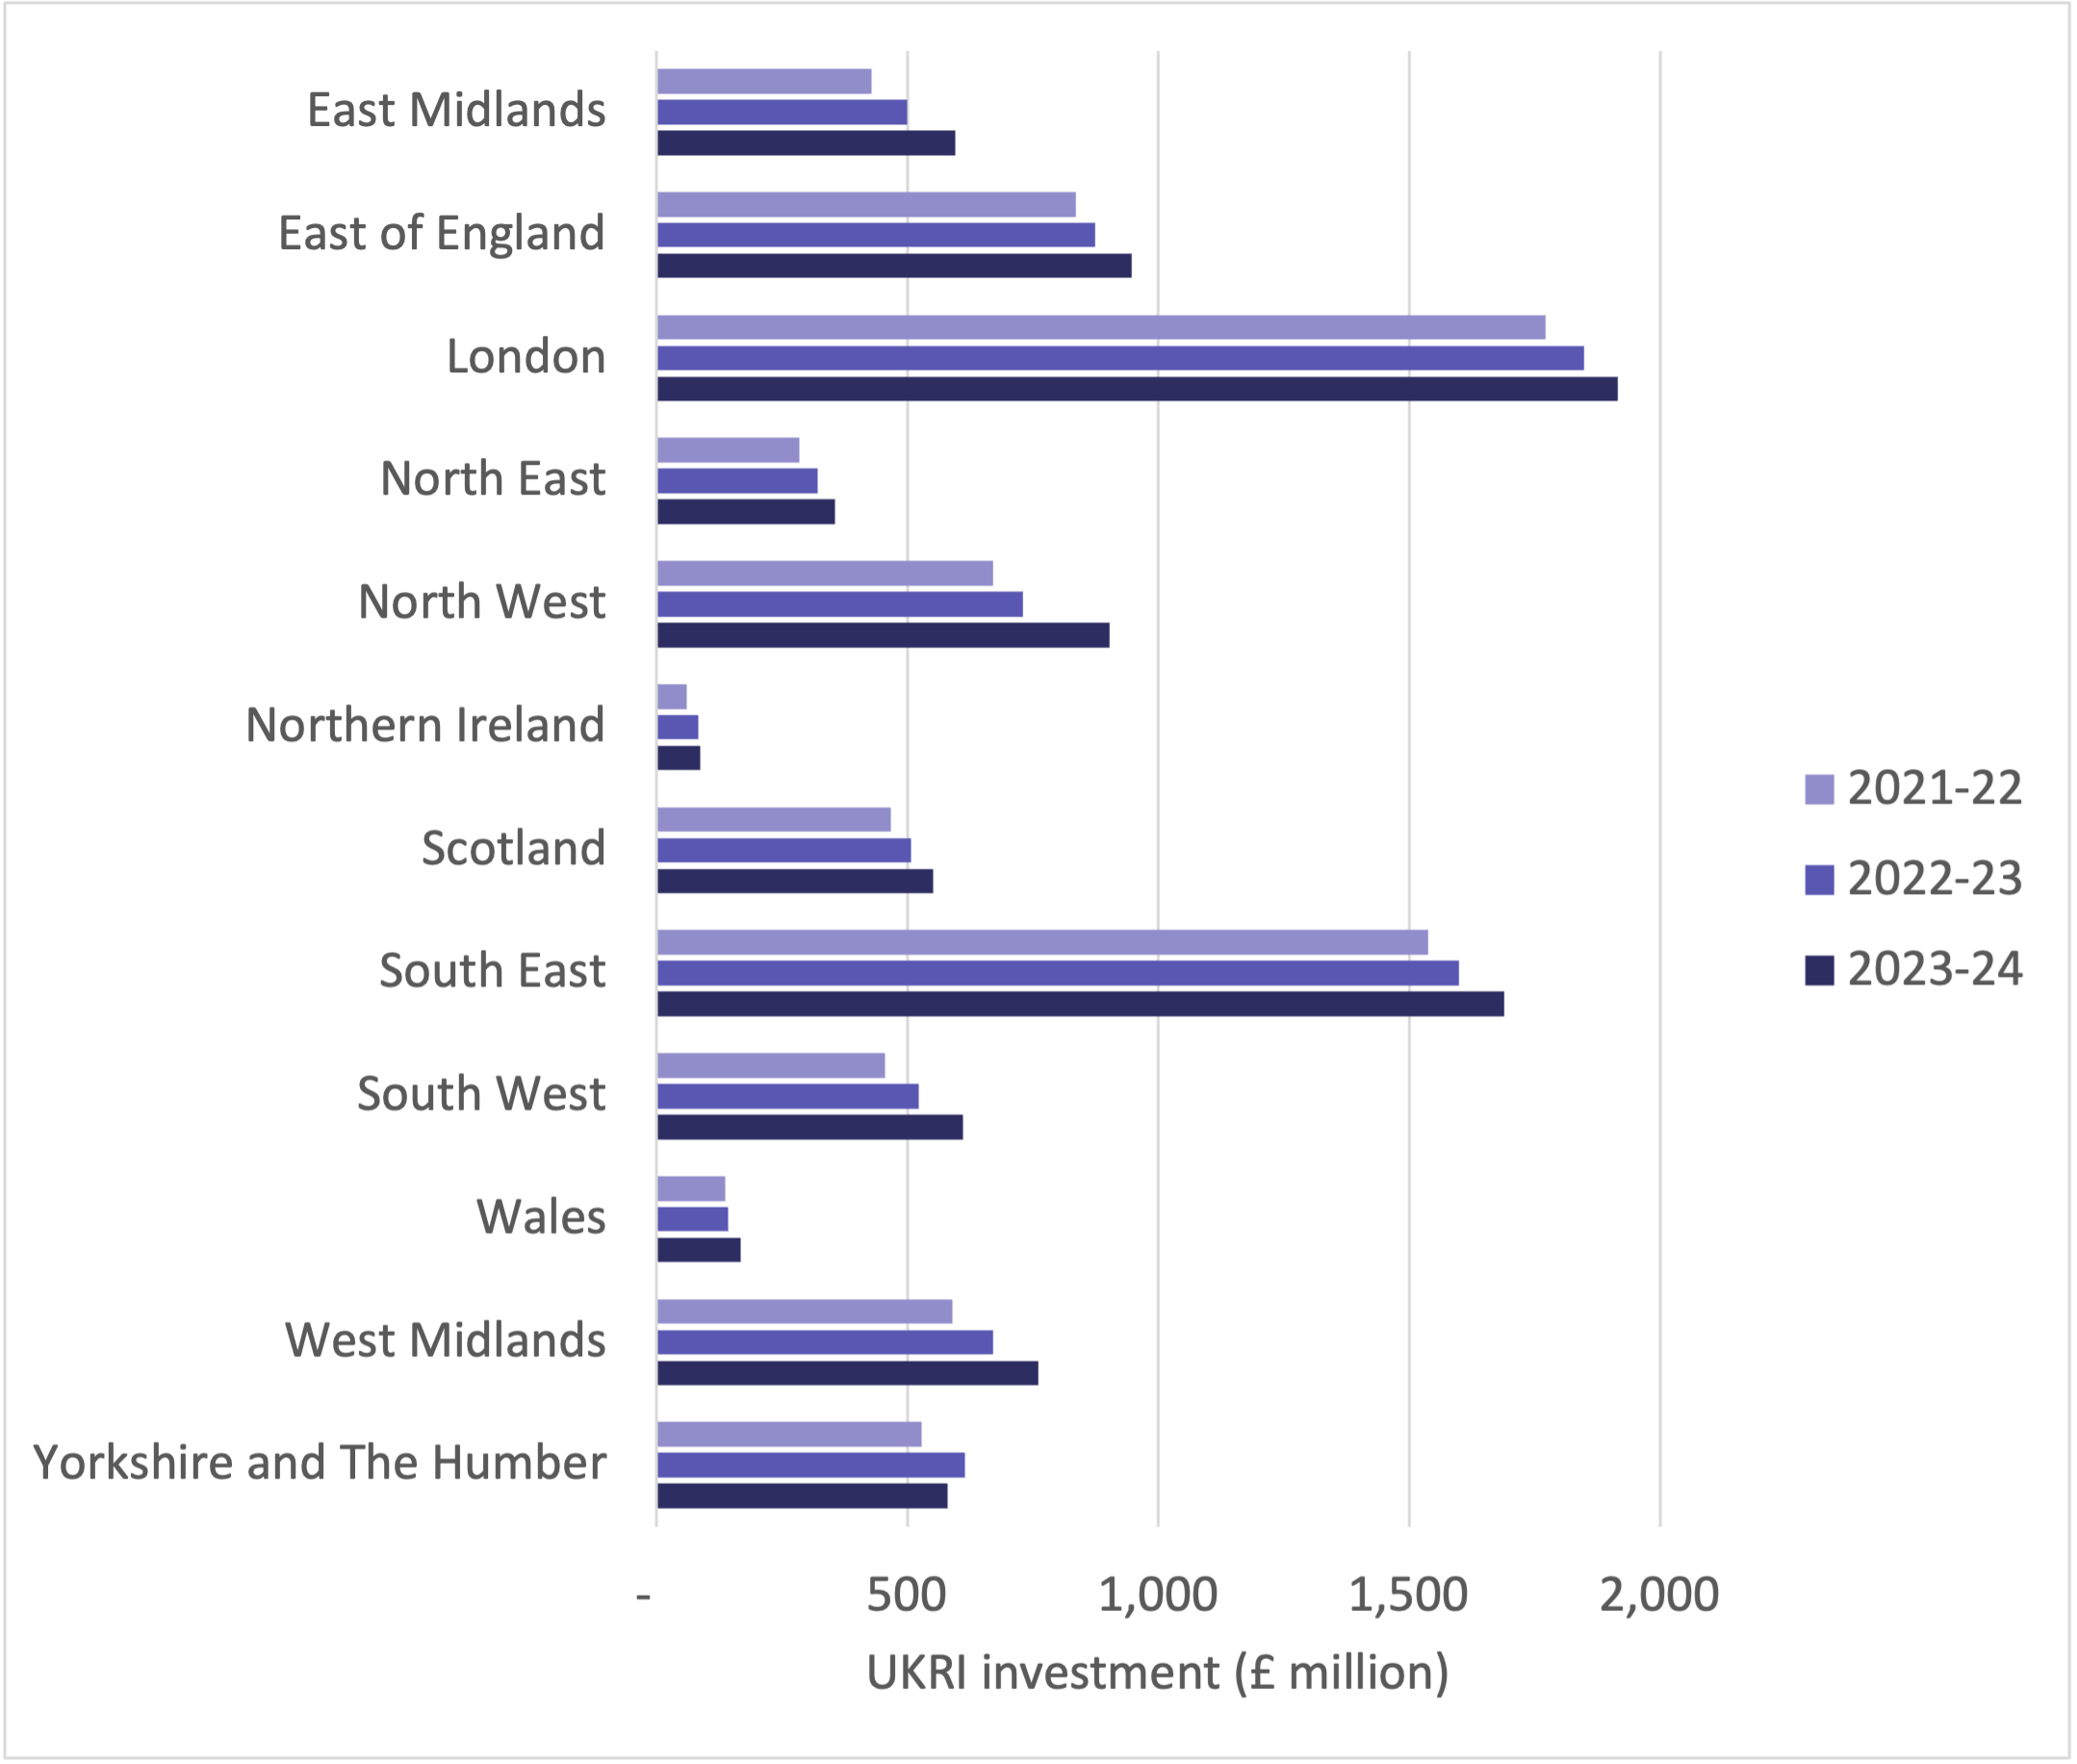
This figure shows the distribution of total UKRI investment in different ITL1 areas in financial years 2021 to 2022, 2022 to 2023 and 2023 to 2024, in millions of pounds.
UKRI investment did not increase in both years in Yorkshire and The Humber, with a £36 million fall in 2023 to 2024. However, the region still saw an overall increase in investment over the three-year period.
All other regions experienced consecutive years of investment growth, with the greatest absolute increases seen in the:
- North West (£232 million)
- West Midlands (£171 million)
- East Midlands (£166 million)
Excluding Yorkshire and The Humber, the smallest absolute increases were seen in the devolved nations. Increases of £26 million in Northern Ireland, £31 million in Wales, and £85 million in Scotland were lower than the average across England of £139 million.
This can partly be explained by the exclusion of research and innovation funding invested by the devolved administrations through their respective national funding bodies, which is outside UKRI’s remit.
Figure 3: percentage increase in UKRI investment by ITL1 area, financial year 2023 to 2024 compared to the 2021 to 2022 financial year
Sources: UKRI financial accounting data, inflation data taken from GDP deflators data published by the Office for National Statistics
Download the data for figure 3 (ODS, 4KB)
Description of figure 3
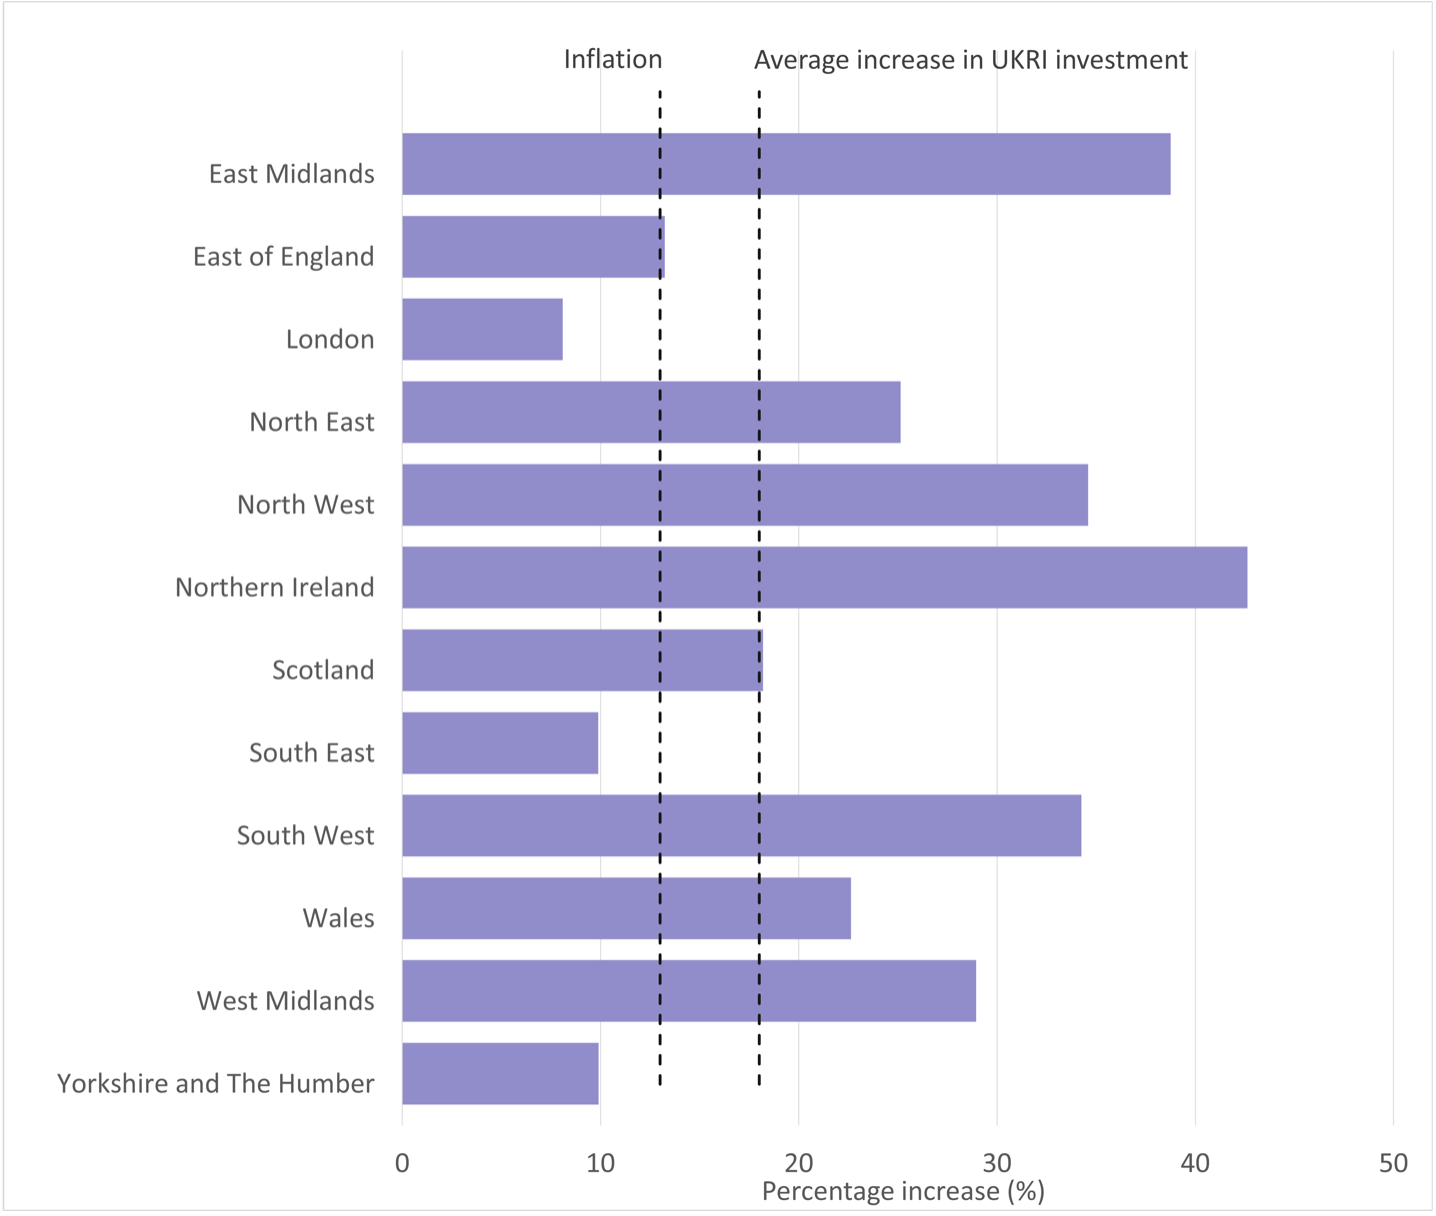
This figure shows the percentage increase in UKRI investment in different ITL1 areas from the 2021 to 2022 financial year to the 2023 to 2024 financial year.
Compared to their level of investment in 2021 to 2022, the devolved nations have seen percentage increases in funding on par with English regions, with Northern Ireland experiencing the greatest proportional increase of any UK area, at 43%.
The North West (35%), West Midlands (29%) and East Midlands (39%) also do well by this measure, outpacing the 18% UK average and 13% inflation that occurred between the 2021 to 2022 financial year and the 2023 to 2024 financial year.
Some of the regions experiencing the smallest proportional increases are the regions with the highest absolute levels of UKRI investment:
- London (8% increase)
- the South East (10%)
- the East of England (13%)
London, the South East and Yorkshire and The Humber received increases in investment over the period that were lower than the rate of inflation. In real terms, these three regions experienced a decline in UKRI investment between the 2021 to 2022 financial year and the 2023 to 2024 financial year.
The regional data shows a trend of higher investment growth rates outside London, the South East and East of England compared to the 18% increase in UKRI’s annual investment from the 2021 to 2022 financial year to the 2023 to 2024 financial year. This was seen particularly in the Midlands, parts of northern England and the devolved nations.
Figure 4: UKRI investment per person by ITL1 area, financial years 2021 to 2022, 2022 to 2023 and 2023 to 2024
Source: UKRI financial accounting data
Download the data for figure 4 (ODS, 5KB)
Description of figure 4
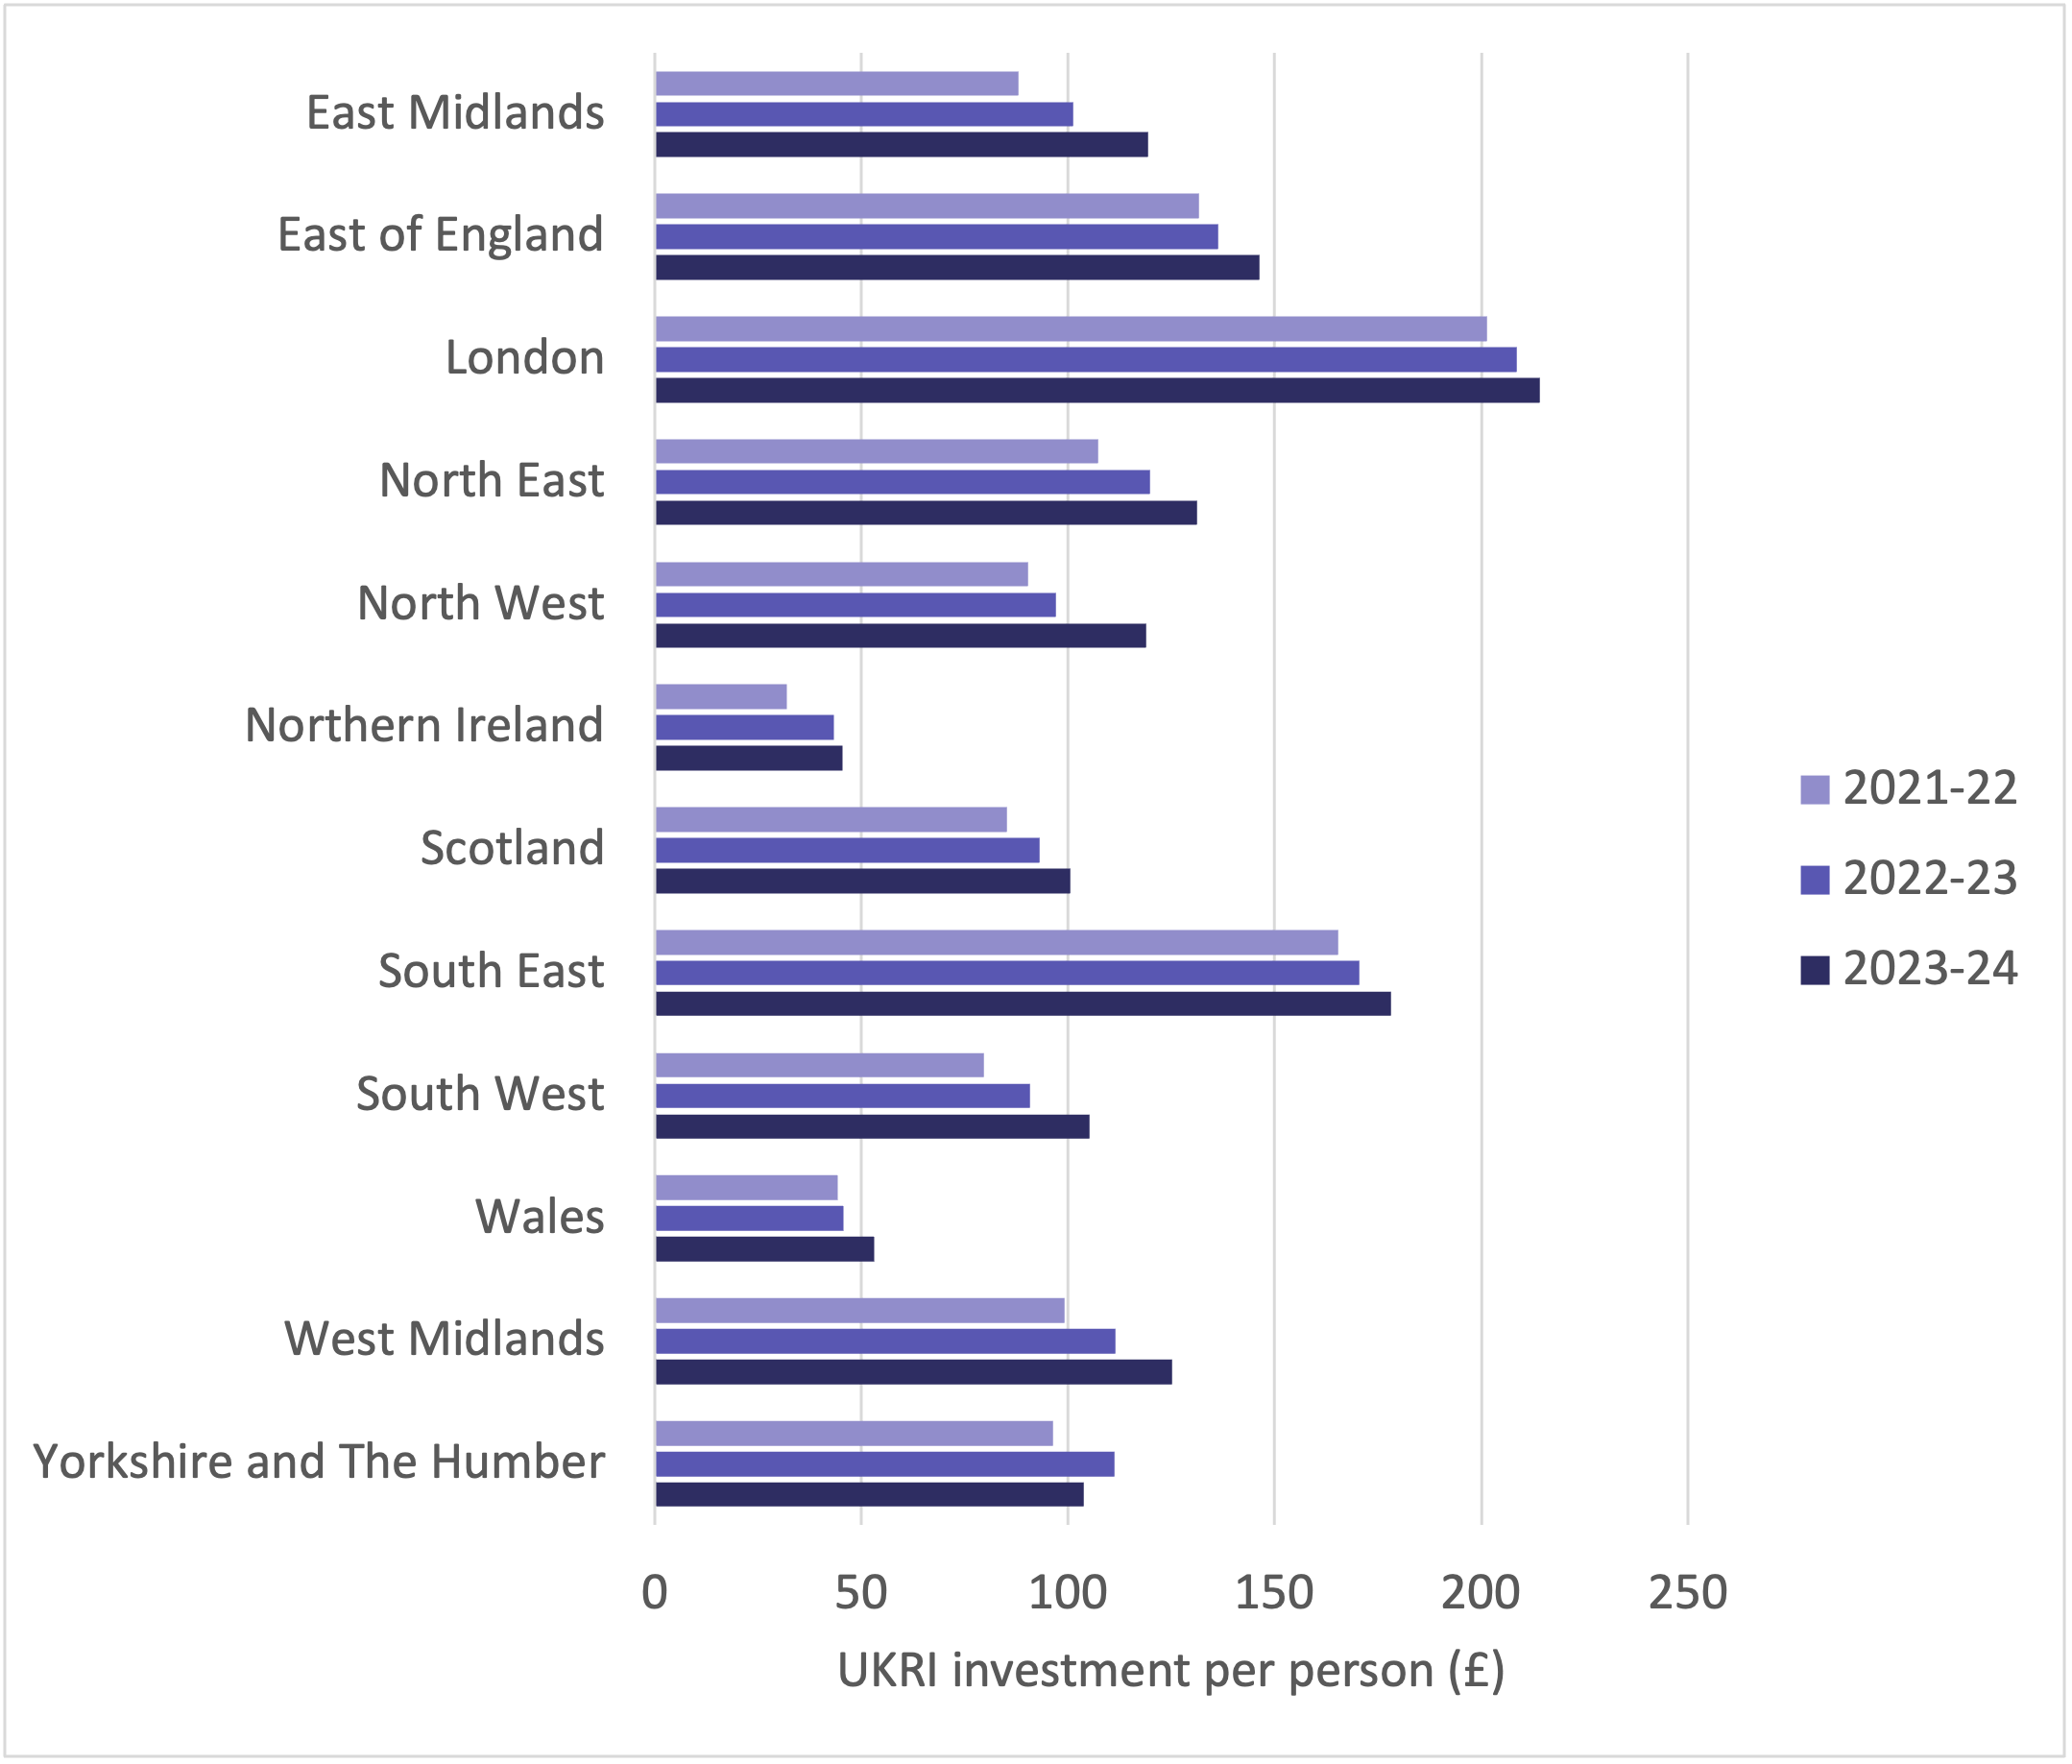
This figure shows the distribution of UKRI investment per person in different ITL1 areas in financial years 2021 to 2022, 2022 to 2023 and 2023 to 2024, in pounds.
Recognising that the UK’s nations and regions vary significantly in both population size and economic activity, we have normalised our data to place UKRI investment data within this context and provide a clearer comparison between areas.
This reduces some of the regional differences in total investment across the UK. While London and the South East continue to receive the highest investment per person, and Northern Ireland and Wales the lowest, other ITL1 areas are fairly comparable, averaging around £120 per person in 2023 to 2024.
All regions and nations saw a rise in overall funding during the period. However, Yorkshire and The Humber did not experience an increase in investment per person over both years.
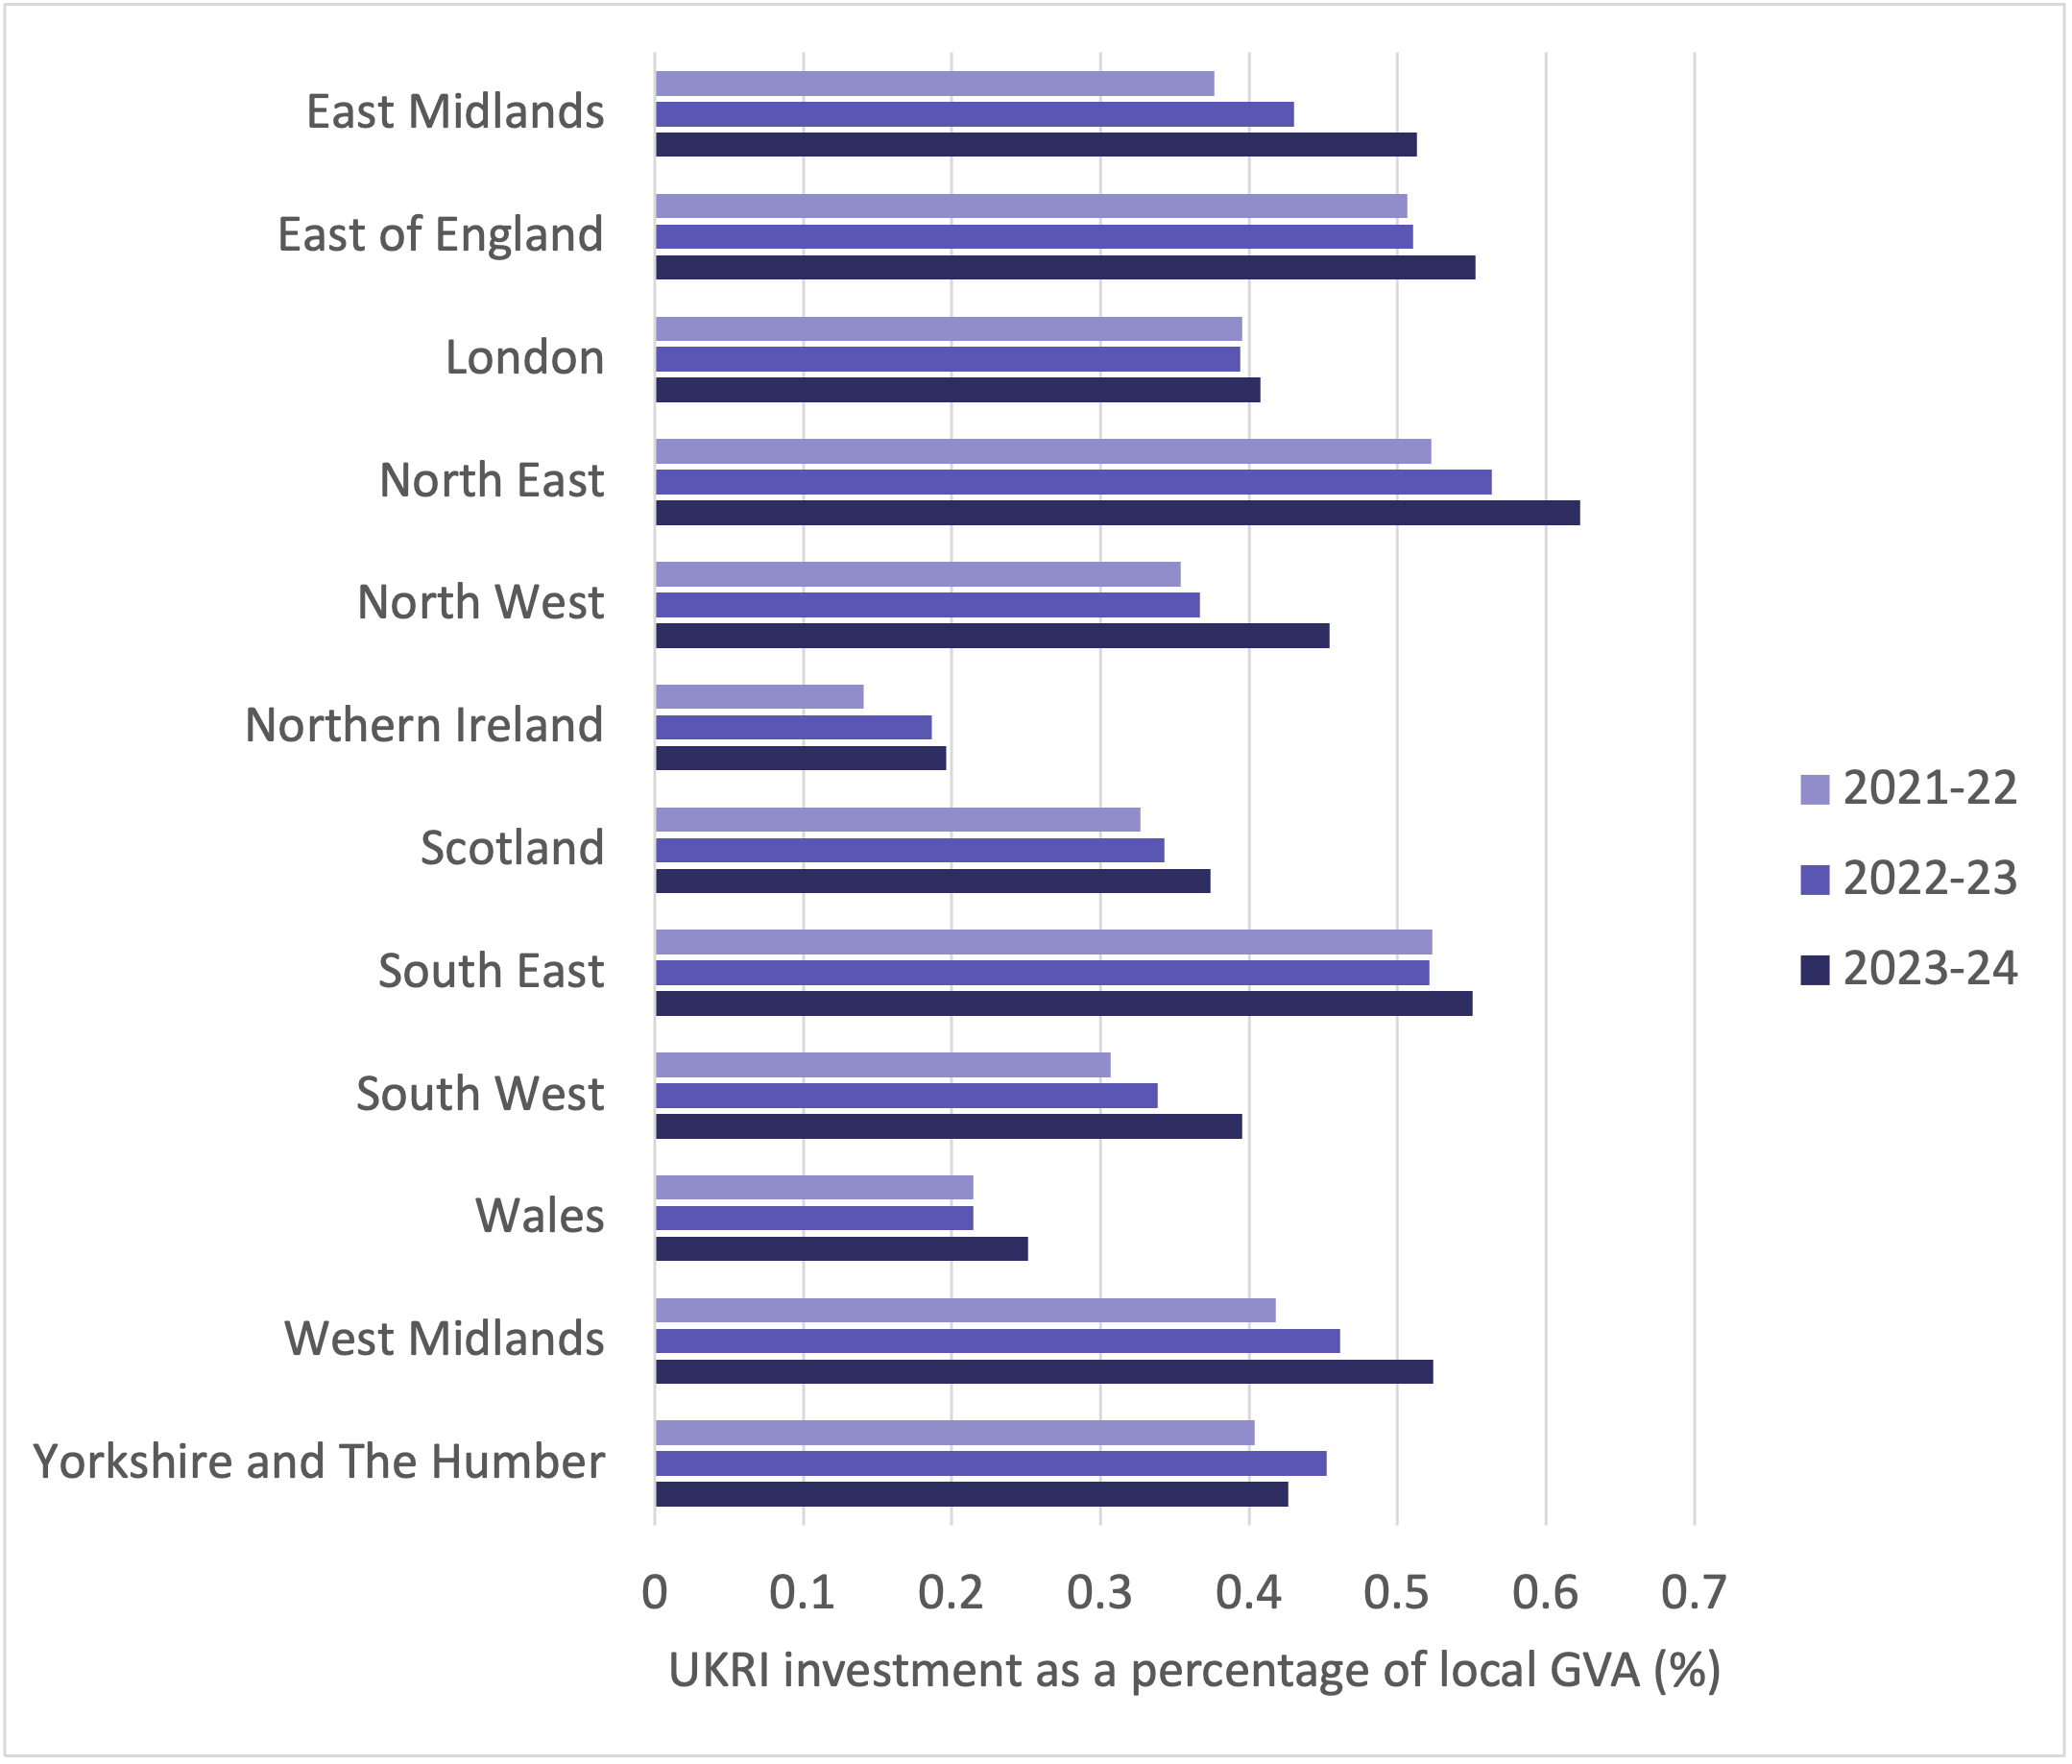
Figure 5: UKRI investment as a percentage of local GVA by ITL1 area, financial years 2021 to 2022, 2022 to 2023 and 2023 to 2024
Source: UKRI financial accounting data
Notes for figure 5: 2022 GVA data is used for both the financial years 2022 to 2023 and 2023 to 2024 as the most recent published data from the Office for National Statistics.
Download the data for figure 5 (ODS, 5KB)
Description of figure 5
This figure shows the distribution of UKRI investment as a percentage of local GVA in different ITL1 areas in financial years 2021 to 2022, 2022 to 2023 and 2023 to 2024.
Over the three years, Northern Ireland and Wales consistently received the least UKRI investment as a proportion of local GVA, while the North East, South East and East of England received the most.
Most regions and nations have seen increases in UKRI investment, although the extent varies.
Areas such as the East and West Midlands, North East and South West have experienced the largest increases, with UKRI investment at a relatively high level compared with the scale of the economies in these areas.
In contrast, areas like London, the South East and Yorkshire and The Humber have seen smaller increases since the 2021 to 2022 financial year. In Yorkshire and The Humber, UKRI investment as a percentage of local GVA fell by 0.026 percentage points in the 2023 to 2024 financial year relative to 2022 to 2023.
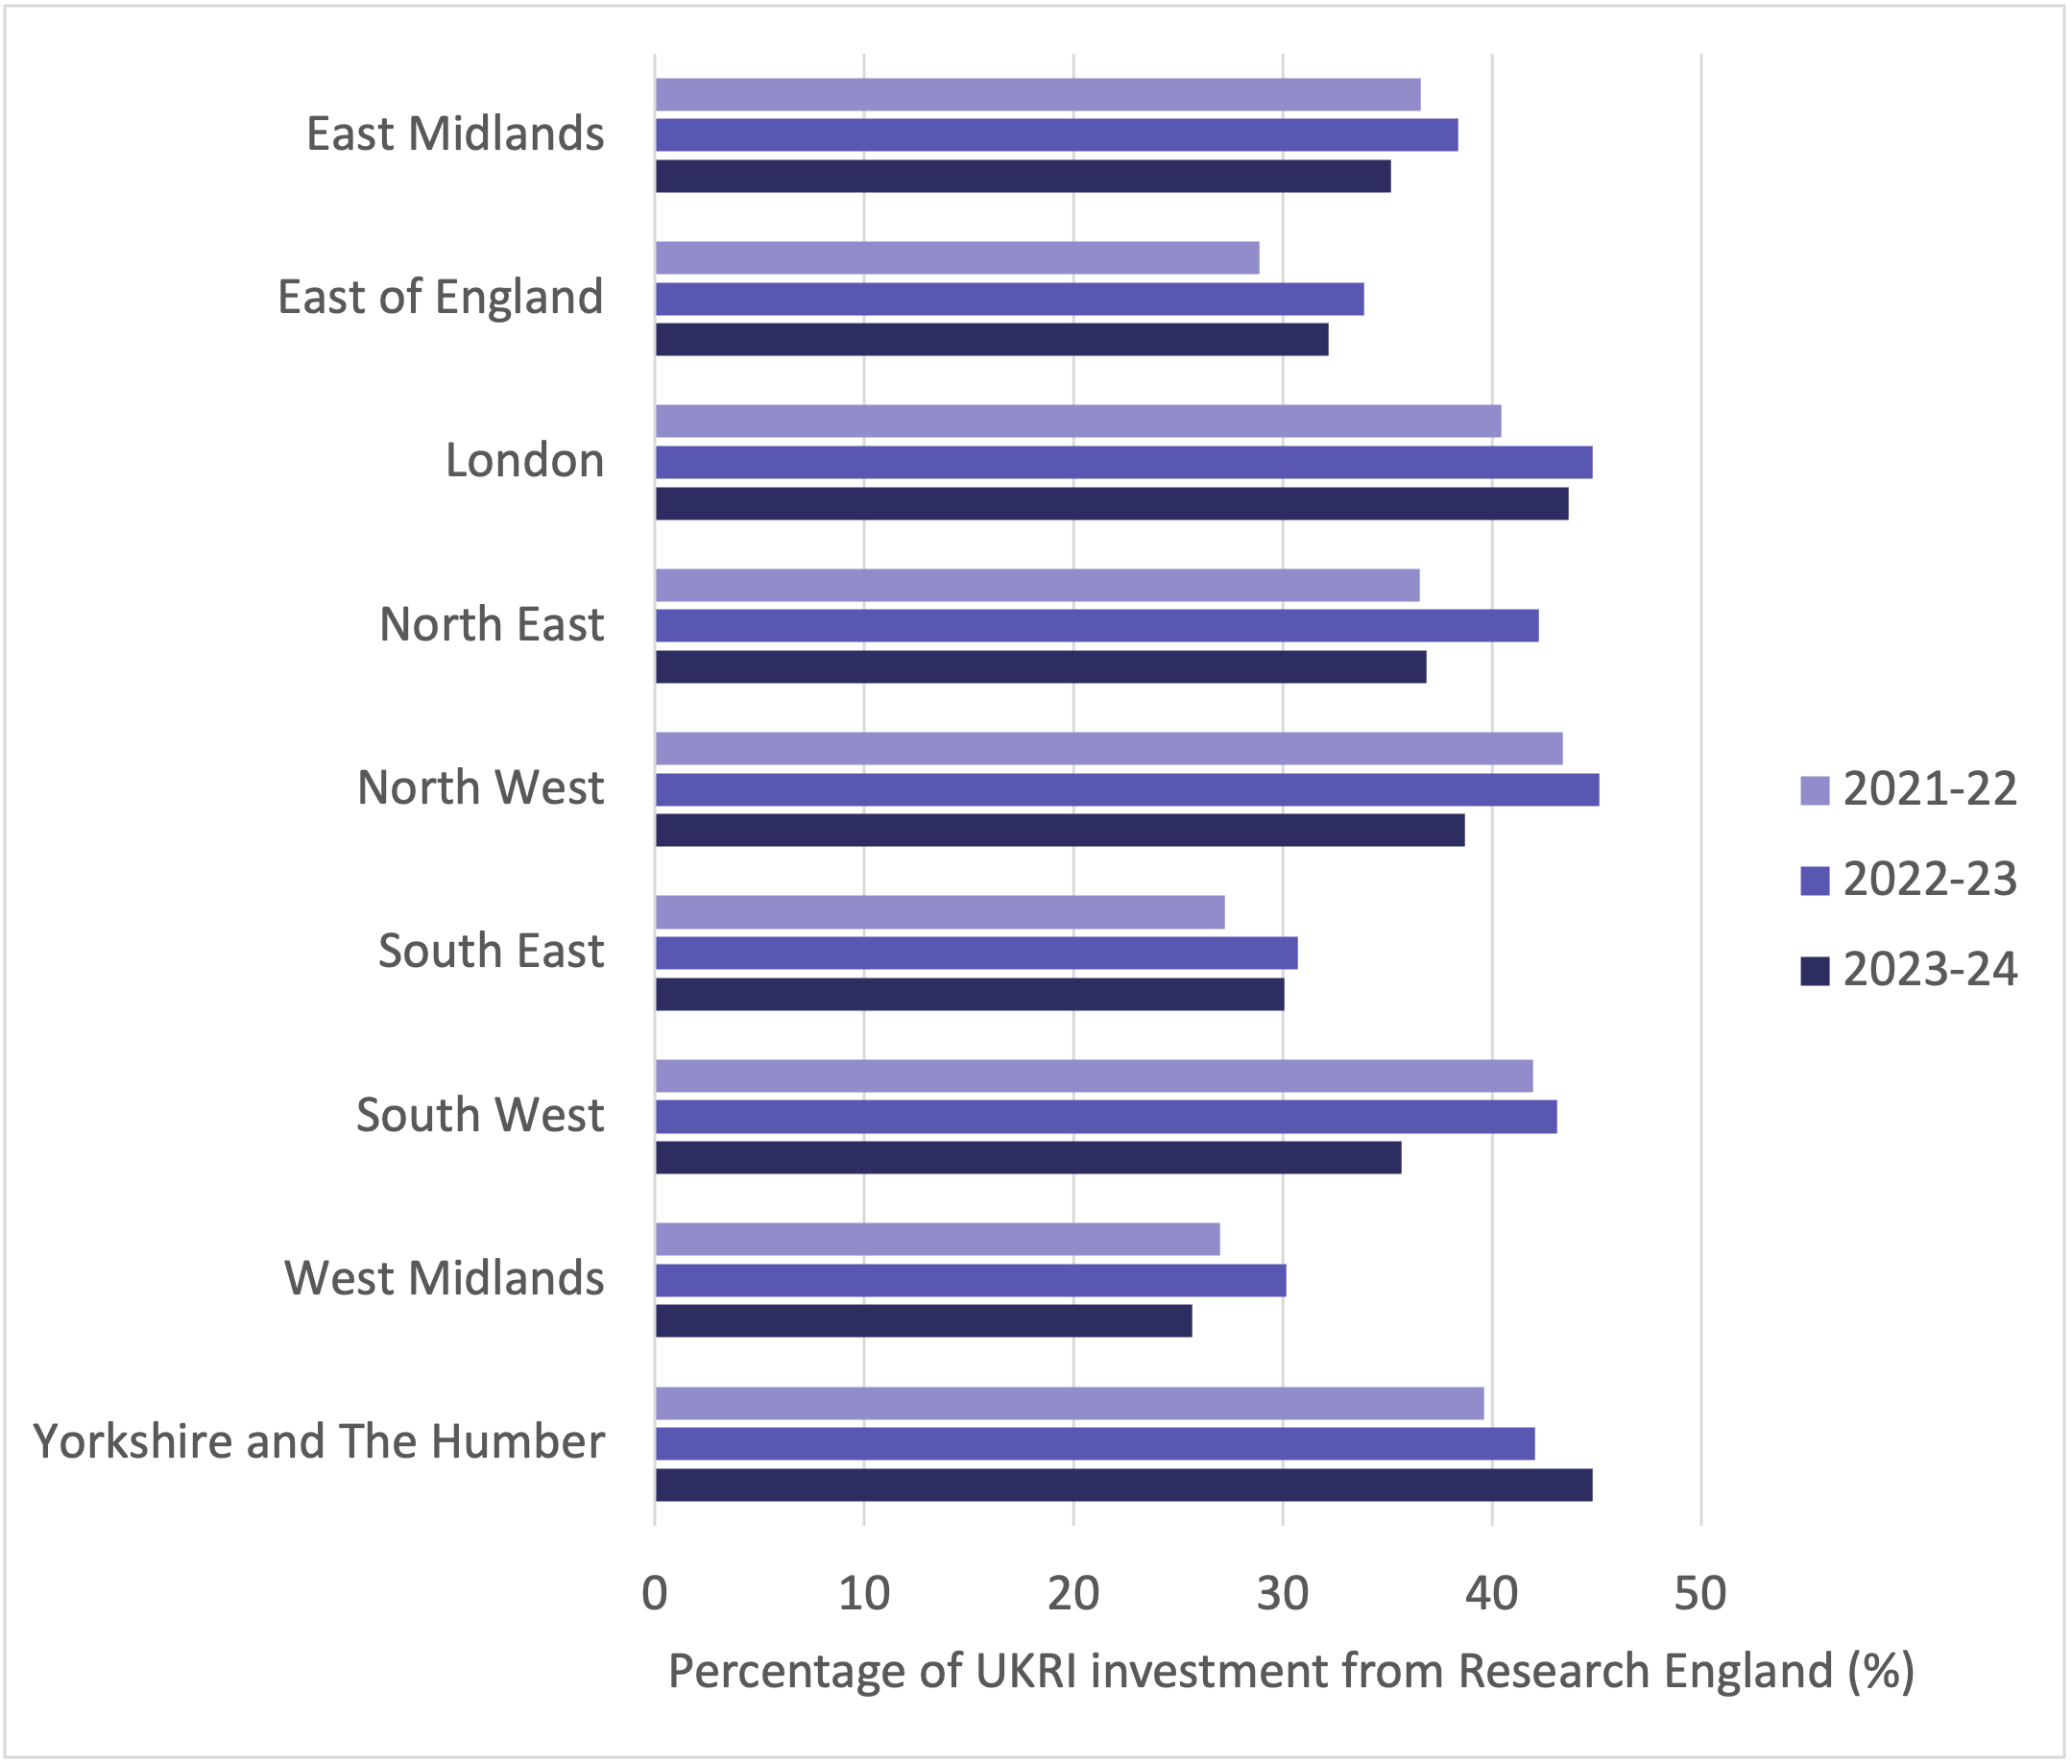
Figure 6: percentage of UKRI investment from Research England by ITL1 area, financial years 2021 to 2022, 2022 to 2023 and 2023 to 2024
Source: UKRI financial accounting data
Download the data for figure 6 (ODS, 5KB)
Description of figure 6
This figure shows the percentage of UKRI investment from Research England in different ITL1 areas in financial years 2021 to 2022, 2022 to 2023 and 2023 to 2024.
Scotland, Wales and Northern Ireland are excluded from this figure because the nations do not receive funding from Research England, whose remit covers England only.
All English regions receive between 25% and 45% of their total UKRI investment through Research England, with most regions receiving between 30% and 40% in 2023 to 2024.
Regions such as Yorkshire and The Humber (45%) and London (44%) received relatively more through Research England in 2023 to 2024 than the average of 36%, while regions including the West Midlands (26%) and South East (30%) received less.
The trend over time for this measure is mixed. Yorkshire and The Humber experienced an increase of 5 percentage points from the 2021 to 2022 financial year to the 2023 to 2024 financial year, while the North West and South West saw declines of 5 and 6 percentage points respectively. Percentages for other regions remained fairly stable over time.
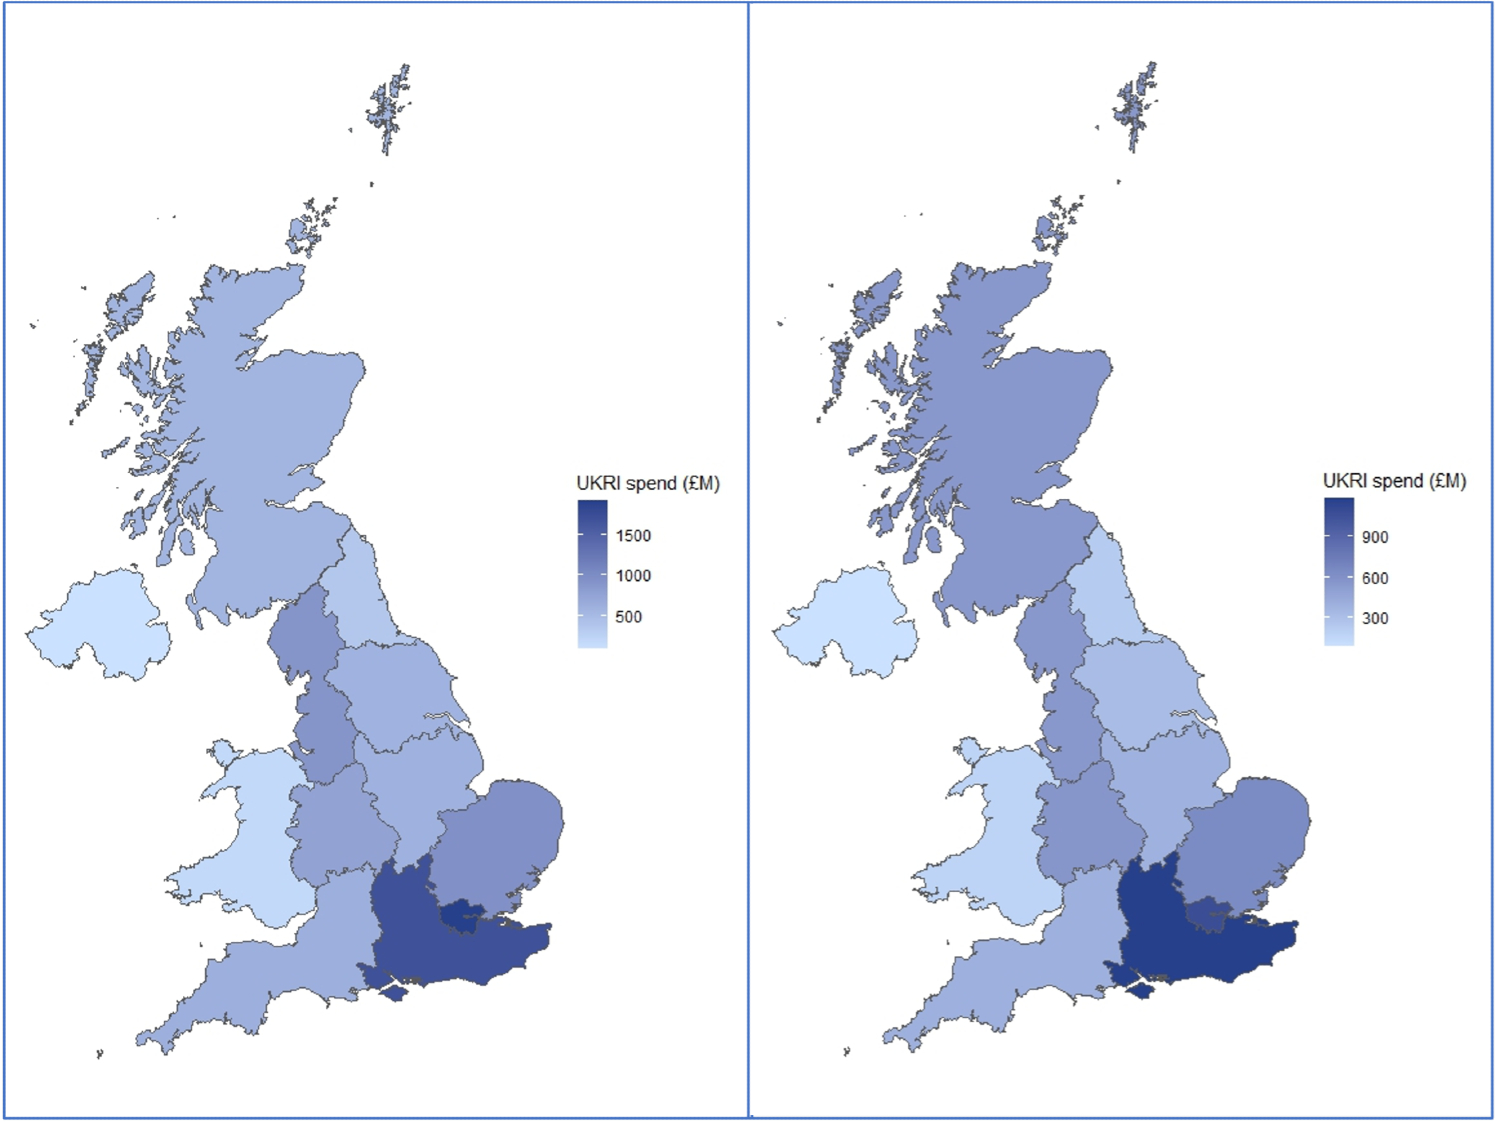
Figure 7: total UKRI investment and research councils, Innovate UK and cross-UKRI investment mapped by ITL1 area, financial year 2023 to 2024
Source: UKRI financial accounting data
Download the data for figure 7 (ODS, 5KB)
Description of figure 7
This figure maps the distribution of total UKRI investment in financial year 2023 to 2024 on the left and the distribution of research councils, Innovate UK and cross-UKRI investment (in other words, UKRI investment excluding Research England) in 2023 to 2024 on the right.
UKRI is a national funding body and most of our funding is delivered on a UK-wide basis. However, UKRI includes Research England which invests in higher education providers in England only.
The devolved administrations in Scotland, Wales, and Northern Ireland are responsible for providing equivalent funding to higher education providers in their nations.
The maps in figure 7 show similar patterns of investment across the UK, with relatively high absolute levels of investment in London and the South East and lower levels of investment in Wales, Northern Ireland and some regions in England.
Scotland stands out as receiving a larger share of UKRI investment when Research England is excluded from analysis. This is indicated on the second map, where Scotland is shown in a darker shade of blue.
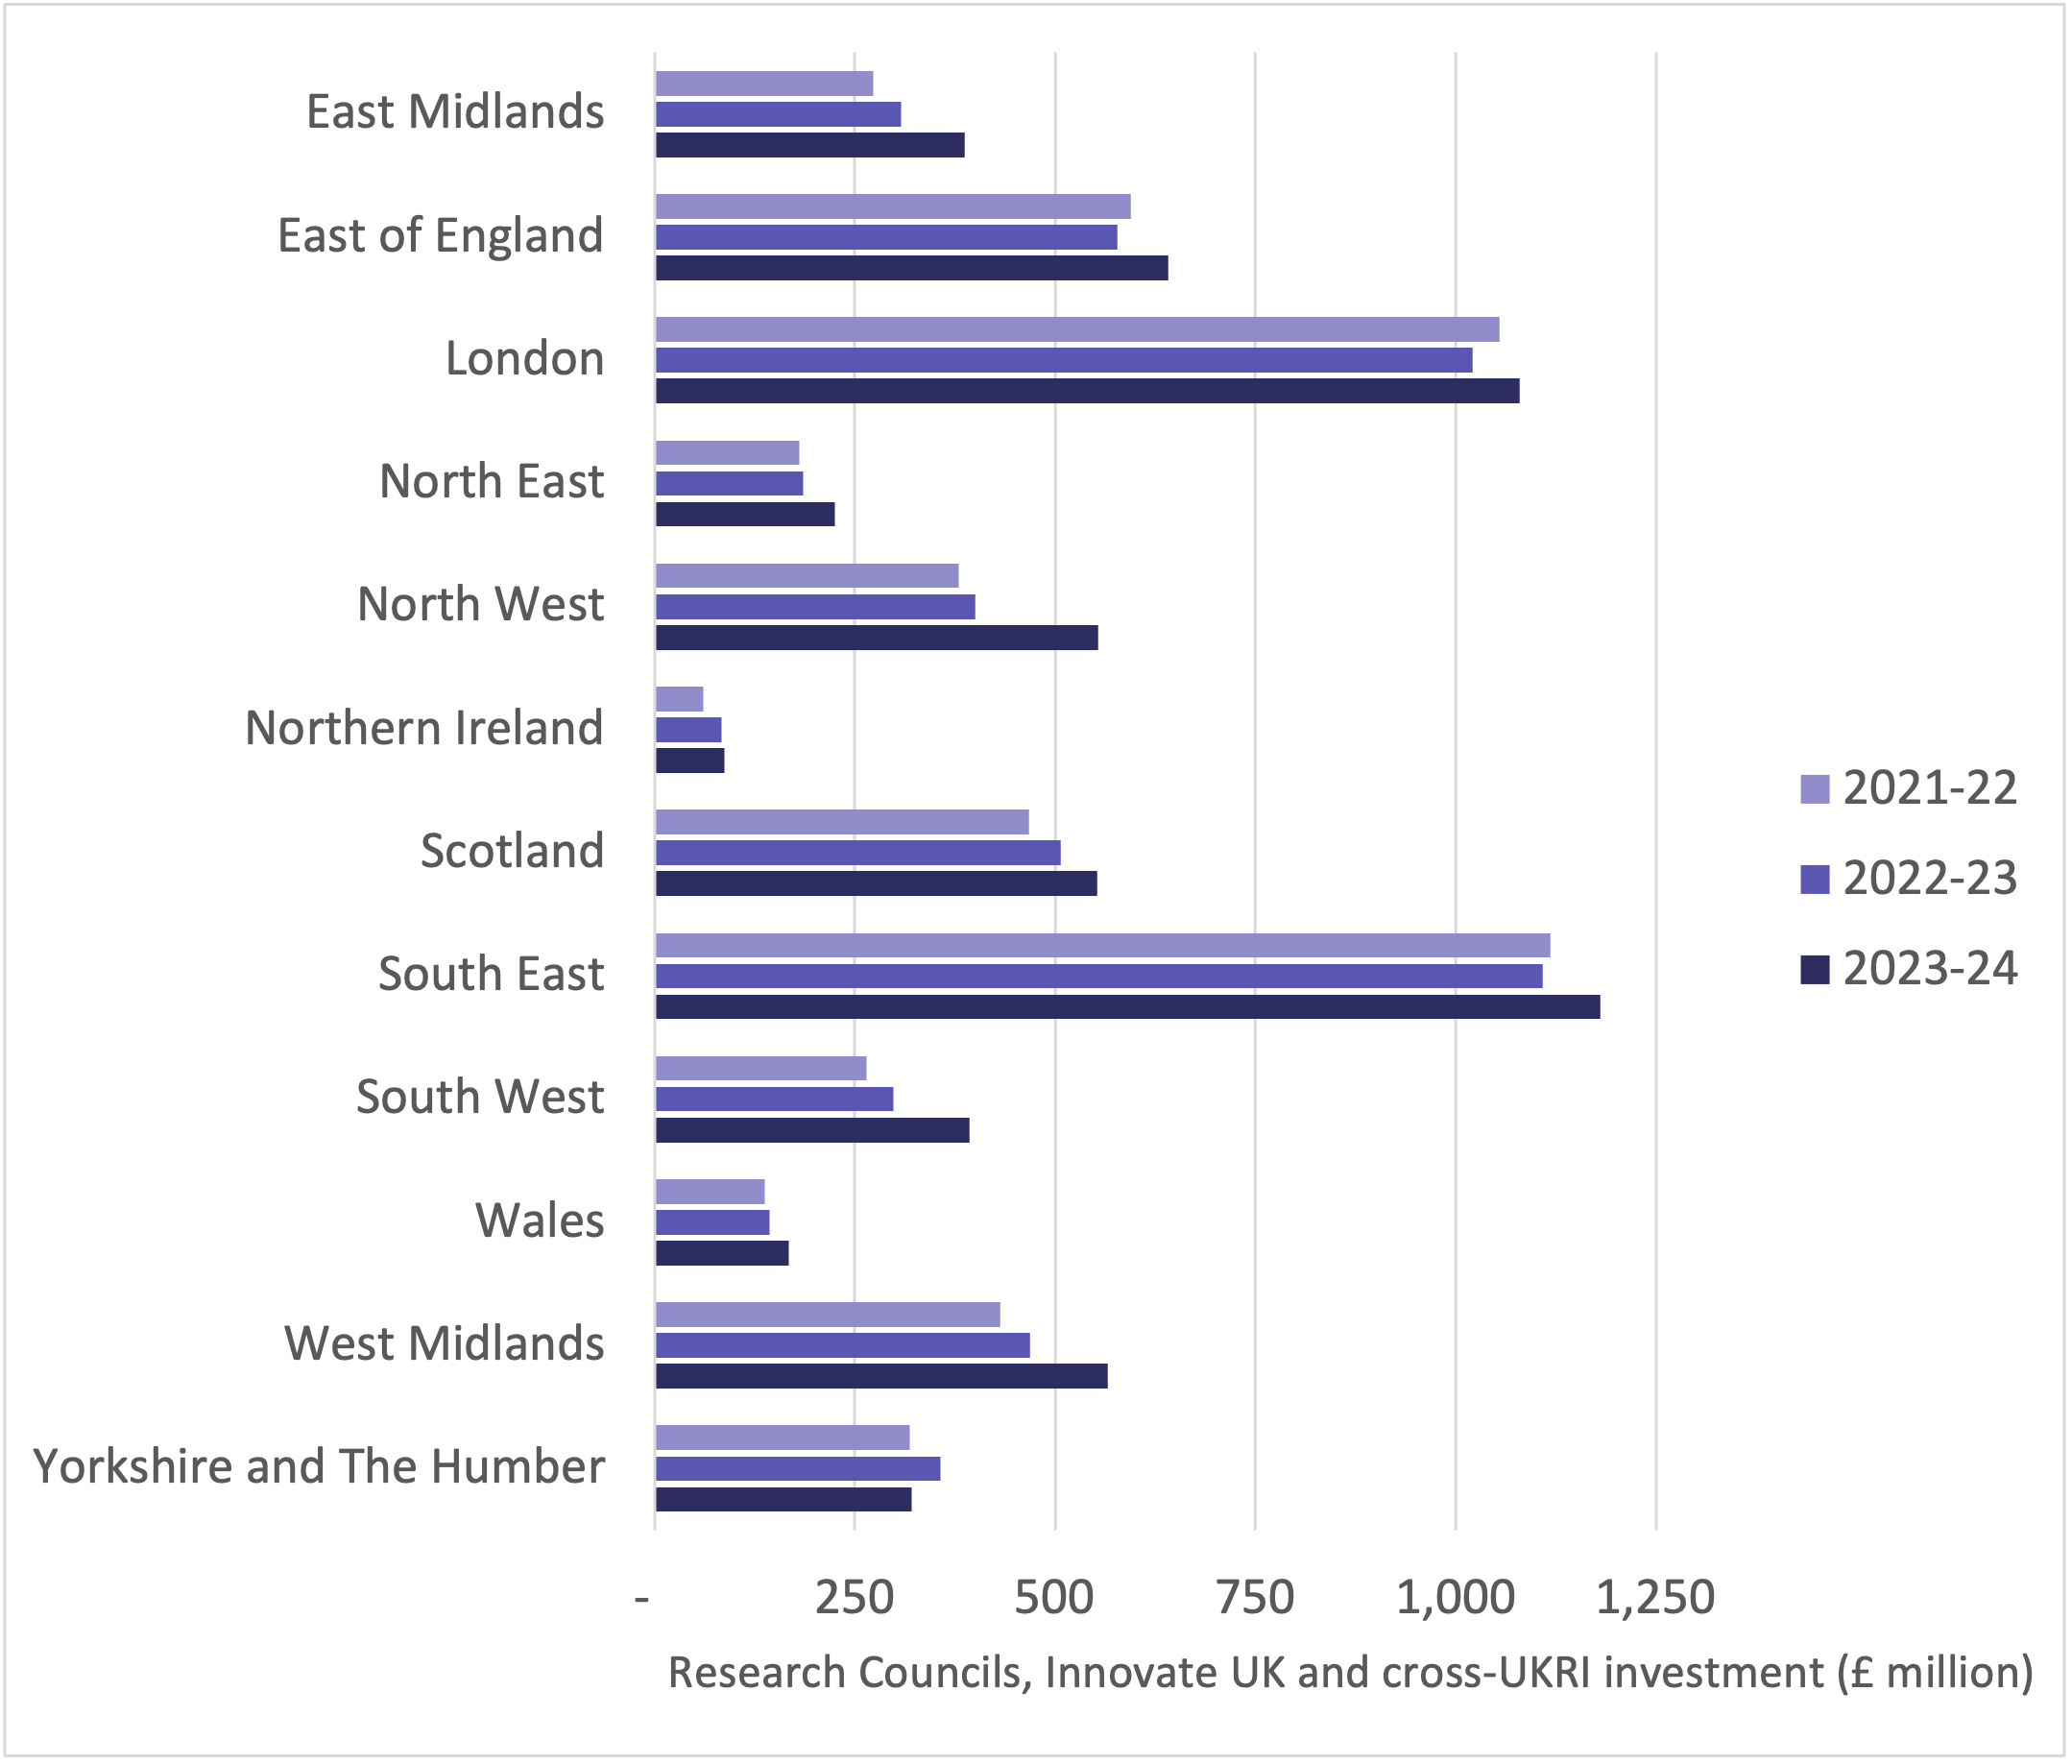
Figure 8: research councils, Innovate UK and cross-UKRI investment by ITL1 area, financial years 2021 to 2022, 2022 to 2023 and 2023 to 2024
Source: UKRI financial accounting data
Download the data for figure 8 (ODS, 5KB)
Description of figure 8
This figure shows the distribution of research councils, Innovate UK and cross-UKRI investment (in other words, UKRI investment excluding Research England) in different ITL1 areas in financial years 2021 to 2022, 2022 to 2023 and 2023 to 2024, in millions of pounds.
Most areas experienced consecutive years of investment growth when Research England funding is excluded, and all experienced an overall rise in investment over the three-year period. This is similar to the trend observed in figure 2, where most regions saw consecutive years of increases in total UKRI investment.
The greatest absolute increases in UKRI investment excluding Research England were seen in the:
- North West (£174 million)
- West Midlands (£135 million)
- South West (£129 million)
These regions also saw some of the greatest increases in total UKRI investment.
The smallest absolute increase in UKRI investment excluding Research England was seen in Yorkshire and The Humber, with a £2 million increase between the 2021 to 2022 financial year and the 2023 to 2024 financial year. This compares to a £52 million increase in total UKRI investment over the same period.
Other areas with lower absolute increases in research councils, Innovate UK and cross-UKRI investment include London (£24 million), the East of England (£47 million) and South East (£62 million), whose increases in total UKRI investment were between two and six times as high (£144 million, £111 million and £152 million respectively).
Data sources and methodology
UKRI has published the geographical distribution of our funding since the 2017 to 2018 financial year and the methodology has improved since then, increasing the amount of UKRI’s research and innovation funding data able to be included in analysis and strengthening our ability to accurately map UKRI investment.
This report examines the changes to UKRI investment in regions and nations in the UK. One lens through which we look at regional distribution is the area known as the ‘Greater South East’, which is comprised of the ITL1 regions of East of England, London, and the South East. These regions have historically received more research and innovation funding from UKRI and other funders.
This report also breaks down UKRI investment by ITL1 regions and devolved nations to analyse regional investment trends.
The data in this report combines data on investments by the research councils, Innovate UK and Research England with UKRI-wide programme investments including the Strength in Places Fund and Innovation Accelerator programme.
All UKRI data is sourced from our financial accounting data, using a methodology that traces payment flows. This approach is the same as our approach for the 2021 to 2022 financial year report. The data in this report is also consistent with the data in UKRI’s annual report and accounts.
Data for years prior to the 2021 to 2022 financial year is not comparable with the data in this report and is therefore excluded.
This report classifies regions according to UK International Territorial Level 1 (ITL1) areas, as defined by the Office for National Statistics.
See our previous report on the 2021 to 2022 financial year for more details on how we have improved our methodology.
Appendix 1: note on methodology
Data coverage
The data in this report is built from UKRI investments as described in the Notes to the Accounts, 5.3 (Research and innovation) in the UKRI annual report and accounts.
UKRI investments captured as part of Note 5.3 include:
- research and innovation grants
- quality research
- talent
- institutes, centres, facilities, and Catapults (European System of Accounts 2010)
- knowledge exchange
- Higher Education Innovation Funding
- international
- managed programmes
- other costs
- Industrial Strategy Challenge Fund
- strategic programmes
- Global Challenges Research Fund
- Newton Fund
- Horizon Europe Guarantee
- infrastructure
- competitive
- administration
The Natural Environment Research Council (NERC), Medical Research Council (MRC) and Science and Technology Facilities Council (STFC) also invest in research institutes beyond the scope of Note 5.3. This report includes UKRI investment data for these institutes, to provide a more comprehensive picture of our funding.
This report does not include accruals (payments that are due but not yet paid). Nor does it include payments made to a constituent part of UKRI, or payments to the higher education funding bodies in Scotland, Wales, and Northern Ireland.
Geographical coverage
In line with the dual support system, UKRI provides research and innovation grant funding UK-wide through the research councils and Innovate UK. We also provide strategic institutional funding to English universities through Research England.
The devolved administrations in Scotland, Wales, and Northern Ireland are responsible for allocating their equivalent to strategic institutional funding through:
- the Scottish Funding Council
- Medr (the Commission for Tertiary Education and Research in Wales)
- the Northern Ireland Department for the Economy
Each devolved administration funding body distributes research and innovation funding according to the research base and policy context of their nation. Such funding is not within the scope of this report.
Overseas funding is also excluded from this report. This includes Official Development Assistance funding, international subscriptions, and funding to international partners on UK projects and programmes.
Contextualising the data
Our analysis of the geographical distribution of UKRI funding highlights variations across regions, with some areas receiving more investment than others.
Recognising that regions differ in both population size and economic activity, and that regions with more people and higher economic output tend to have a greater capacity to conduct research and innovation activities, we have normalised our funding data to provide a clearer comparison.
This normalised data shows UKRI investment per person and as a percentage of local GVA, offering insight into how our funding aligns with local population and economic context. We obtained Office for National Statistics data sets on:
This report classifies regions according to international territorial level 1 (ITL1) areas, as defined by the Office for National Statistics. Data reflects boundaries in place as of April 2023.
More granular data, including normalised data by population and local GVA, is available in:
Investment versus allocations data
The entire award amount for successful UKRI grant applications is allocated in the year the award is made, but payments will be spread across the lifetime of the grant, which can span several years.
Data in this report reflects the amount of research and innovation funding spent, rather than allocated, in the financial years 2022 to 2023 and 2023 to 2024.
Headquartering effects
We map the distribution of UKRI funding by linking recipient organisations to their registered postcodes and linking these postcodes to UK ITL1 areas.
Headquartering effects occur where an organisation’s registered location is not where UKRI-funded research and innovation takes place. This can distort the data and paint an inaccurate picture of where we are investing.
We identify three types of headquartering effect that may impact the accuracy of our data:
- where the location of a UKRI-funded organisation reflects its registered or main location, but not the location where UKRI-funded research and innovation is taking place
- where the location on record reflects only the lead organisation in a consortium
- where the location on record reflects the initial destination of funding, but not the locations of further activities by recipient organisations, for example, Catapult centres
Our analysis suggests that headquartering effects do not materially distort the regional distribution of our funding at the ITL1 level.
Using revised postcodes from application data where a ‘work’ postcode was available as well as a ‘registered’ postcode, Innovate UK data has been adjusted for the first type of headquartering effect.
MRC institutes can have multiple locations in addition to their primary address, including international locations. To better represent where research and innovation has taken place, we have adjusted MRC institute data using data from additional financial reporting processes and quinquennial reviews.
NERC centres can have multiple locations in addition to their primary address where R&I is performed. This is also reflected in NERC’s large infrastructure investments which often take place across different locations. This headquartering effect has not been adjusted for in the data, besides exclusion of the Antarctic Logistics and Infrastructure Partition.
Adjustments for other types of headquartering effect have not been made in this report.
Appendix 2: note on award rates
As mentioned in Appendix 1, our analysis of the geographical distribution of UKRI funding highlights variations across regions, with some areas receiving more investment than others.
Recognising that regions differ both in terms of the number of applications and awards in a region, and the value of those applications and awards, this appendix shows award rates in different ITL1 areas in financial years 2021 to 2022, 2022 to 2023 and 2023 to 2024.
UKRI provides data on competitive funding decisions based on funding allocations data. Due to a focus on allocations rather than investment, the methodology is not strictly comparable with this report. However, the data still provides useful context for considering research and innovation activity and excellence.
Award rates are published separately and can be explored in our UKRI investment and outputs publication or on our ‘UKRI Competitive Funding Decisions’ Tableau dashboards for financial years:
Note that data for commercial organisations are not included in the dashboard.
Table 7: UKRI award rates by number by ITL1 area, financial years 2021 to 2022, 2022 to 2023 and 2023 to 2024
| ITL1 area | 2021-22 | 2022-23 | 2023-24 |
|---|---|---|---|
| East Midlands | 25% | 27% | 21% |
| East of England | 24% | 28% | 25% |
| London | 19% | 23% | 18% |
| North East | 26% | 31% | 24% |
| North West | 27% | 30% | 24% |
| Northern Ireland | 27% | 30% | 25% |
| Scotland | 25% | 32% | 27% |
| South East | 23% | 27% | 23% |
| South West | 23% | 29% | 25% |
| Wales | 21% | 25% | 23% |
| West Midlands | 25% | 28% | 22% |
| Yorkshire and The Humber | 28% | 33% | 24% |
Download the data for table 7 (ODS, 4KB)
Table 8: UKRI award rates by value by ITL1 area, financial years 2021 to 2022 to 2023 to 2024
| ITL1 area | 2021-22 | 2022-23 | 2023-24 |
|---|---|---|---|
| East Midlands | 26% | 26% | x |
| East of England | 24% | 29% | x |
| London | 21% | 29% | x |
| North East | 23% | 35% | x |
| North West | 26% | 35% | x |
| Northern Ireland | 39% | 38% | x |
| Scotland | 26% | 33% | x |
| South East | 24% | 32% | x |
| South West | 25% | 31% | x |
| Wales | 24% | 32% | x |
| West Midlands | 20% | 31% | x |
| Yorkshire and The Humber | 32% | 27% | x |
Notes for table 8: x indicates that award rates by value for the 2023 to 2024 financial year are not available.