
Background
In the 2021 to 2022 financial year, UK Research and Innovation (UKRI) invested nearly £8 billion to advance our understanding of people and the world around us and deliver benefits to society, the economy and the environment. Find further details about our investments in our annual report and accounts.
UKRI supports a full spectrum of research and innovation (R&I). Capitalising on the UK’s extraordinary talent to put the UK at the forefront of solutions to national and global challenges.
We are committed to supporting outstanding R&I across all regions and nations in the UK, helping them grow capacity and develop strengths to perform R&I.
In line with the dual funding support system, UKRI provides R&I grants UK-wide through the research councils and Innovate UK, and strategic institutional funding to English universities through Research England.
The devolved administrations in Scotland, Wales, and Northern Ireland are responsible for allocating their equivalent to strategic institutional funding through the:
- Scottish Funding Council
- Higher Education Funding Council for Wales
- Northern Ireland Department for the Economy
Each devolved administration funding body distributes R&I funding according to the research base and policy context of their nation.
UKRI has published the geographical distribution of our investment since the 2017 to 2018 financial year and the methodology has improved each year.
The 2021 to 2022 financial year data has a single source, which has improved the coverage and consistency of data. This enables UKRI data to inform Levelling Up policies in a more meaningful way.
We expect to apply the same methodology to future data. This will enable meaningful comparisons of change over time. However, these improvements mean that this dataset is not comparable with previous years.
The financial year 2021 to 2022 forms the baseline year for the Department for Science, Innovation and Technology’s target for increasing investment outside the Greater South East.
Interpreting the data
Data methodology
Data for the research councils, Innovate UK and Research England were all sourced from UKRI financial accounting data, using the same methodology to trace the flow of money spent by UKRI on research and innovation funding in the financial year 2021 to 2022.
This approach has resulted in close to 100% of UKRI’s research and innovation funding data being included in our analysis. More information on data sources and coverage is available in Annex 1. Note we have not included accruals (payments that are due but not yet paid) in this analysis.
The new approach provides a more consistent baseline dataset against which to measure UKRI’s performance. However, the investment data for the 2021 to 2022 financial year is not comparable with previous publications of the geographical distribution of our investment. It should not be included in comparative analysis with previous years.
Contextualising the data
This publication does not attempt to establish a causal link between local factors and the distribution of UKRI funding. We have included contextual indicators to show different ways to look at regional ‘hotspots’ of funding.
Normalising investment data by gross value added (GVA) allows us to see funding in the context of local economic output. However, regions with greater economic output may also have greater R&I capacity, resulting in organisations within these regions securing more funding.
This publication classifies investment according to international territorial level 1 (ITL1) areas, as defined by the Office for National Statistics.
More detailed investment data for ITL2 areas and to contextualise investment data by GVA, population, and the number of researchers is available from:
- our public Tableau dashboard
- the statistical supplement
The impact of UKRI funding often extends beyond the regional boundaries within which an investment takes place. Equally, people in one region often benefit from the outcomes and impacts of R&I that has taken place elsewhere.
Investment versus allocations data
The data presented reflects the amount of research and innovation funding invested by UKRI in the financial year 2021 to 2022. We measure this through the amount of money spent in 2021 to 2022, not the amount allocated in 2021 to 2022.
This avoids a reconciliation problem when multiple years of funding are allocated within a single year, resulting in an uneven distribution of allocations data, spikes in some years followed by zero funding in others.
Headquartering effect
The headquartering effect happens when a company’s registered location is in one place but there are other sites where the funded R&I takes place. This can distort the data, wrongly indicating that funding has ended up in the administrative headquarters of companies.
We identify three types of headquartering effect that may impact how accurately UKRI investment data reflects the actual location of research and innovation activity. The types of headquartering effect are:
- where the location of a UKRI-funded institution reflects its registered or main location but not the location where UKRI-funded R&I is taking place
- where the location on record reflects only the lead organisation in a consortium
- where the location on record reflects the initial destination of UKRI funding but not the locations of further activities by recipient organisations, for example, Catapult centres
The impact of these effects is the subject of ongoing analysis. Innovate UK data for the 2021 to 2022 financial year has been adjusted for the first type of headquartering effect. We used revised postcodes from application data where a ‘work’ postcode was available as well as a ‘registered’ postcode.
The postcode used depended on availability, according to the following hierarchy:
- The postcode associated with a defined project and organisation.
- The postcode associated with the highest amount of funding applied for.
- The postcode shown in the transparency data.
The Medical Research Council (MRC) institutes can have multiple locations in addition to their primary address. We have adjusted the MRC institute data for the 2021 to 2022 financial year to better represent where R&I has been performed, rather than the primary institute address. In particular where R&I has been performed across multiple locations for:
- the London School of Hygiene and Medicine
- the UK Dementia Research Institute
- Heath Data Research UK
To adjust MRC data, we have used data from MRC’s institute and unit annual science reporting process and the most recent quinquennial review to divide up investment appropriately.
Other types of headquartering effect have not been adjusted for in the data.
UKRI’s geographical distribution of investment
The following figures and analysis are based on financial transactions data for over £7.7 billion of UKRI funding across the R&I system and the UK.
An additional £200 million of UKRI investment has been excluded due to a lack of postcode information, for example overseas investment and payments to PO boxes or individuals.
More information on the scope of the data is available in Annex 1. Note that we have not included accruals (payments that are due but not yet paid) in this analysis.
Table 1: UKRI investment in England by ITL1 area, financial year 2021 to 2022
| ITL1 area | Total investment (£ million) | Investment per person (£) | Investment as a percentage of local GVA |
|---|---|---|---|
| East Midlands | 429 | 88 | 0.4% |
| East of England | 835 | 132 | 0.5% |
| London | 1,772 | 201 | 0.4% |
| North East | 284 | 107 | 0.5% |
| North West | 671 | 90 | 0.4% |
| South East | 1,537 | 165 | 0.5% |
| South West | 455 | 80 | 0.3% |
| West Midlands | 590 | 99 | 0.4% |
| Yorkshire and The Humber | 528 | 96 | 0.4% |
Table 2: UKRI investment by nation, financial year 2021 to 2022
| ITL1 area | Total investment (£ million) | Investment per person (£) | Investment as a percentage of local GVA |
|---|---|---|---|
| England | 7,102 | 126 | 0.4% |
| Northern Ireland | 61 | 32 | 0.1% |
| Scotland | 467 | 85 | 0.3% |
| Wales | 137 | 44 | 0.2% |
| UK total | 7,767 | 116 | 0.4% |
Download the data for tables 1 and 2 (ODS, 5KB) or see tables 1.3 and 1.4 of the statistical supplement.
Notes for tables 1 and 2: reported totals in the ‘Total investment’ column may not equal the sum of the component parts due to rounding.
Table 3: UKRI investment outside the Greater South East, financial year 2021 to 2022
| Area | Total investment (£ million) | Investment per person (£) | Investment as a percentage of local GVA |
|---|---|---|---|
| Outside the Greater South East | 3,623 | 85 | 0.4% |
| Inside the Greater South East | 4,144 | 170 | 0.5% |
| UK total | 7,767 | 116 | 0.4% |
Download the data for table 3 (ODS, 4KB) or see tables 3.2 and 3.3 of the statistical supplement.
A slight majority of UKRI funding is invested in the Greater South East
Figure 1: heat map of total UKRI investment by ITL1 area, financial year 2021 to 2022
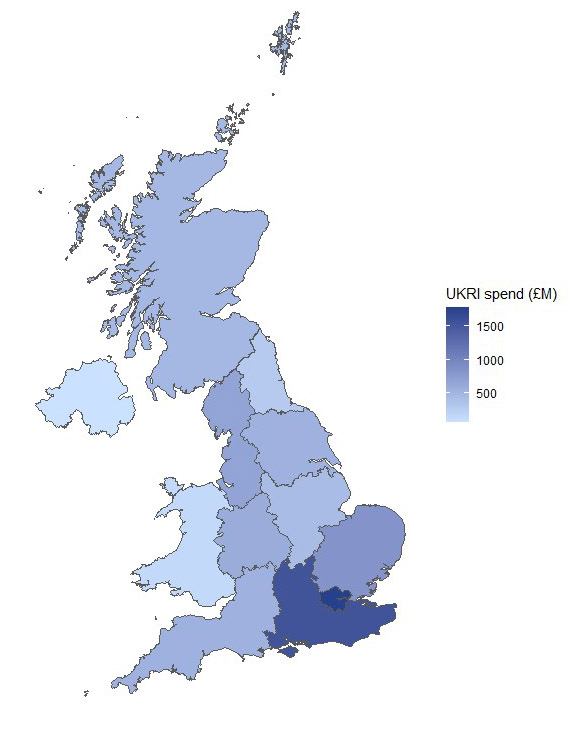
Description of figure 1
This map shows London received the most UKRI funding in the financial year 2021 to 2022, followed closely by the South East (England).
The regions with the next highest UKRI funding were the East of England, North West, West Midlands and Yorkshire and The Humber.
Scotland received the most UKRI funding of the three devolved nations, though still below average at the UK level. Wales and Northern Ireland received the least funding of all UK regions and nations, by a considerable margin.
Download the data for figure 1 (ODS, 4KB) or see table 1.1 of the statistical supplement.
Geographical distribution of UKRI investment is mostly unchanged when excluding Research England
Figure 2: heat map of total UKRI investment by ITL1 area, excluding Research England, financial year 2021 to 2022
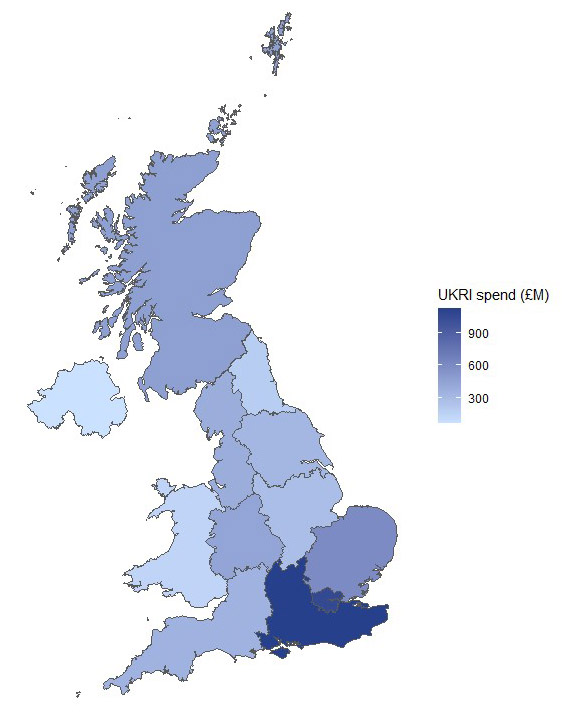
Description of figure 2
This map excludes Research England funding from UKRI total investment and shows the South East (England) received the most UKRI funding in the financial year 2021 to 2022, followed closely by London.
The regions and nations with the next highest UKRI funding were the East of England, Scotland, West Midlands and the North West.
As in figure 1, Wales and Northern Ireland received the least funding of all UK regions and nations. However, Scotland performs considerably better at the UK level when Research England funding is excluded.
Source: UKRI financial accounting data
Download the data for figure 2 (ODS, 4KB) or see table 1.1 of the statistical supplement.
UKRI’s national distribution of investment
England
Over 91% of UKRI’s funding in the 2021 to 2022 financial year was invested in England.
Adjusted for population and local economic output (presented as GVA), UKRI’s funding in England is equivalent to £126 per person and 0.4% of GVA.
UKRI’s investment in England was the highest of the four UK nations, both in absolute terms and when normalised by economic activity or population.
Note that UKRI figures include investment by Research England, whose remit covers England only. The devolved administrations in Scotland, Wales, and Northern Ireland allocate equivalent funding to Research England through their respective funding bodies.
Outside the Greater South East, the region with the highest UKRI investment was the North West, at £671 million, or 9% of total UKRI investment. 57% of UKRI investment in this region was from research councils, Innovate UK and cross-UKRI funding. 43% was from Research England.
The English regions with the highest UKRI investment as a percentage of local GVA were the South East, North East and East of England, at 0.5%. London ranks in the middle at 0.4%, despite receiving nearly £1.8 billion of funding.
Normalising the data by population, the North East received the most UKRI funding per person outside of the Greater South East, at £107. This is despite the regions receiving the least amount of funding overall in England, £284 million.
Over 91% of UKRI’s funding is invested in England
Table 4: UKRI investment in England by council and programme investment, financial year 2021 to 2022
| ITL1 area | Research councils, Innovate UK and cross-UKRI funding | Research England funding | ||
|---|---|---|---|---|
| £ million | % of England total | £ million | % of England total | |
| East Midlands | 272 | 6% | 157 | 6% |
| East of England | 594 | 13% | 241 | 10% |
| London | 1,055 | 23% | 717 | 29% |
| North East | 180 | 4% | 104 | 4% |
| North West | 380 | 8% | 291 | 12% |
| South East | 1,118 | 24% | 419 | 17% |
| South West | 264 | 6% | 191 | 8% |
| West Midlands | 431 | 9% | 159 | 6% |
| Yorkshire and The Humber | 319 | 7% | 209 | 8% |
| England total | 4,613 | 100% | 2,489 | 100% |
Download the data for table 4 (ODS, 5KB) or see table 1.1 of the statistical supplement.
Notes: reported totals may not equal the sum of the component parts due to rounding.
Northern Ireland
Around 1% of UKRI’s funding (excluding Research England) in 2021 to 2022 was invested in Northern Ireland. The total amount of £61 million is equivalent to £32 per person.
The devolved administration in Northern Ireland is responsible for allocating their equivalent to strategic institutional funding through the Northern Ireland Department for the Economy.
Scotland
The total amount of funding invested in Scotland in financial year 2021 to 2022 was £467 million, which was 9% of the total UKRI funding, excluding Research England. This accounted for 0.3% of local GVA and representing a per person funding amount of £85.
The devolved administration in Scotland is responsible for allocating their equivalent to strategic institutional funding through the Scottish Funding Council.
Wales
A total of £137 million, or just under 3% of UKRI’s total, funding excluding Research England, for the 2021 to 2022 financial year was invested in Wales. Equivalent to £44 of UKRI funding per person.
The devolved administration in Wales is responsible for allocating their equivalent to strategic institutional funding through the Higher Education Funding Council for Wales.
Less than 4% of research councils, Innovate UK and cross-UKRI funding is invested in Wales and Northern Ireland
Table 5: research councils, Innovate UK and Cross-UKRI funding by nation, financial year 2021 to 2022
| Nation | £ million | % of UK total |
|---|---|---|
| England | 4,613 | 87% |
| Northern Ireland | 612 | 1% |
| Scotland | 467 | 9% |
| Wales | 137 | 3% |
| UK total | 5,278 | 100% |
Download the data for table 5 (ODS, 4KB) or see table 2.1 of the statistical supplement.
Supporting the Levelling Up mission
UKRI investment is part of the government’s strategy to support the Levelling Up mission.
An integral part of the Levelling Up White Paper is the government’s mission to increase research and innovation investment outside the Greater South East by a third by the 2024 to 2025 financial year, compared to 2021 to 2022.
Using a definition consistent with the Office for National Statistics, outside the Greater South East is defined as all of the other international territorial level 1 (ITL1) areas:
- North East
- North West
- Northern Ireland
- Scotland
- South West
- Wales
- East Midlands
- West Midlands
- Yorkshire and The Humber
Based on almost £7.8 billion of investment in financial year 2021 to 2022, about half (47%) of UK Research and Innovation (UKRI) funding was invested outside the Greater South East. This is equivalent to a total of £3.6 billion.
Regional variation in economic activity and population provides additional perspectives for contextualising the distribution of UKRI investment.
Adjusted for local economic activity, UKRI investment represented 0.5% with the Greater South East and 0.4% outside the Greater South East of GVA.
Putting the data in the context of population density shows that the Greater South East received £170 per person versus £85 per person outside the Greater South East.
Of the £3.6 billion invested outside the Greater South East, £2.5 billion (69%) came from:
- research councils
- Innovate UK
- cross-UKRI funding
Research England’s remit is England only. In the 2021 to 2022 financial year, Research England invested £1.1 billion outside the Greater South East, making up 31% of UKRI funding received outside the Greater South East.
Research councils, Innovate UK and cross-UKRI funding made up 67% of the funding received in the Greater South East. 33% of Greater South East funding came from Research England.
The regional distribution of research organisations and institutes influences the geographical distribution of research council investment.
There is a concentration of research institutes in the Greater South East that drives up the investment in that region.
Most of UKRI’s investment outside the Greater South East comes from Research councils, Innovate UK and cross-UKRI funding
Table 6: Percentage of UKRI funding invested inside and outside the Greater South East by source of funding, financial year 2021 to 2022
| Source of funding | Greater South East | Outside the Greater South East | ||
|---|---|---|---|---|
| £ million | % | £ million | % | |
| Research councils, Innovate UK and cross UKRI funding | 2,767 | 67% | 2,511 | 69% |
| Research England | 1,377 | 33% | 1,112 | 31% |
| Total | 4,144 | 100% | 3,623 | 100% |
Download the data for table 6 (ODS, 19KB) or see table 3.1 of the statistical supplement.
Annex 1: note on methodology
‘Top-down’ versus ‘bottom-up’ approaches
This analysis utilises a ‘top-down’ approach to analyse the geographical distribution of UKRI’s funding in financial year 2021 to 2022, using payments data from our financial accounts.
However, we also considered a ‘bottom-up’ approach, using applications data in a way consistent with the methodology of UKRI’s previous two publications of our geographical distribution of investment.
The ‘bottom-up’ approach involves using the organisational affiliations of project leads and co-leads from successful grant applications to attribute UKRI’s investment to UK regions and nations.
This would have required the compilation of funding data from several data sources that do not collect data in the same way: the Joint Electronic Submission system, Siebel, Innovate UK’s Funding Service, and off-system data sources for infrastructure and block grant funding.
Around 25% of UKRI funding, excluding Research England, is not recorded at project level and therefore not attributable to any region. Using the ‘bottom-up’ approach would have required excluding this funding from analysis, resulting in partial coverage of only 75% of funding.
In contrast, the ‘top-down’ approach uses payments data held in UKRI’s finance system to estimate the geographical distribution of investment and covers close to 100% of UKRI’s funding.
This payments data is also used in UKRI’s annual report and accounts to generate the Consolidated Statement of Comprehensive Net Expenditure.
For these reasons, the investment data used in this analysis has been estimated using the ‘top-down’ approach.
Specifically, the geographical distribution is built from UKRI’s funding as described in the Notes to the Accounts, 5.3 (Research and innovation).
UKRI Investments captured as part of Note 5.3 include:
- research and innovation grants
- quality research
- talent
- institutes, centres, facilities, and Catapults (European System of Accounts 2010)
- knowledge exchange
- Higher Education Innovation Funding
- international
- managed programmes
- other costs
- Industrial Strategy Challenge Fund
- strategic programmes
- Global Challenges Research Fund
- Newton Fund
- infrastructure
- competitive
- administration
The Natural Environment Research Council, MRC, and the Science and Technology Facilities Council invest in research institutes that are not in scope of note 5.3.
Investment data for these institutes have been included in our analysis to appropriately reflect the nature of UKRI’s funding across the research and innovation system.
Data collection mechanisms
Introduction of a new UKRI Funding Service across UKRI aims to provide greater detail surrounding project costs in grant applications, and therefore a better idea of where UKRI funding is likely to flow beyond the lead institution.
A new UKRI data warehouse (DataBank) aims to consolidate all UKRI investment and portfolio data in a single data set. This will reduce the coverage gap of the ‘bottom-up’ approach by adding previously off-system and block grant funding data.
Introduction of a new UKRI finance system (SHARP) aims to provide better award-level investment data for analysis by requiring the capture of consistent details across all funding types.
The SHARP programme also aims to improve data quality and accessibility across UKRI’s finance system, making it easier for finance teams to bring data together from across the organisation.
Together, these developments should combine the benefits of ‘top-down’ and ‘bottom-up’ approaches to analysing the geographical distribution of UKRI’s investment.
Other considerations
The nature of UKRI’s financial data means that transactions are categorised based on which Research Council (including Research England and Innovate UK) is administering the grant, rather than the owner of the grant or programme.
In addition to geographical breakdowns of the data by region and nation, contextual indicators are also applied to the investment data to account for differences in population and economic output between UK regions and nations.
These indicators use additional data sets obtained from publicly available sources such as the Higher Education Statistics Agency and the Office for National Statistics.
While we have used the most recent data where available, this may not match the financial year presented in this publication. More information is available in the statistical supplement.
Innovate UK investments are also contextualised by the number of businesses and number of research and innovation-active businesses in a region. The latter defined as the number of companies claiming research and development tax credits.
These data sets are sourced from the former Department for Business, Energy and Industrial Strategy and HM Revenue and Customs, respectively.
Annex 2: note on award rates
Award rates provide important context to investment data, both in terms of the number of applications and awards in a region, and the value of those applications and awards.
UKRI provides data on competitive funding decisions based on funding allocations data. Due to a focus on awarded funding rather than investment, the methodology is not entirely comparable with this publication. However, these data still provide useful context for considering R&I activity and excellence.
Award rates are published separately and can be explored on our UKRI Competitive Funding Decisions 2021 to 2022 Tableau dashboard.
The award rates by number and value for UKRI funding allocations for financial year 2021 to 2022 are relatively uniform across regions and nations, ranging between 22% and 32% for award rate by number, and between 20% and 33% for award rate by value.
Even though the North West of England and Yorkshire and The Humber received only 8% and 7% respectively of total UKRI investment in 2021 to 2022, they are the top performers in terms of award rates. This is indicative of excellent research taking place in these regions.
Award rates by number for Wales and Northern Ireland are the lowest of all UK regions and nations, at only 22% compared to a UK total of 28%. However, Northern Ireland has a considerably higher award rate by value, at an above average 29%.
The data suggest that a greater volume of applications leads to more R&I funding overall, even when relatively fewer applications are successful.
Most regions and nations have similar award rates by number, but award rates by value can differ significantly across the UK
Table 7: UKRI award rates in England by ITL1 area, financial year 2021 to 2022
| ITL1 area | Award rate by number | Award rate by value |
|---|---|---|
| East Midlands | 28% | 31% |
| East of England | 28% | 27% |
| London | 27% | 27% |
| North East | 26% | 23% |
| North West | 32% | 30% |
| South East | 28% | 29% |
| South West | 27% | 30% |
| West Midlands | 27% | 20% |
| Yorkshire and The Humber | 31% | 33% |
Table 8: UKRI award rates by nation, financial year 2021 to 2022
| Nation | Award rate by number | Award rate by value |
|---|---|---|
| England | 28% | 27% |
| Northern Ireland | 22% | 29% |
| Scotland | 27% | 28% |
| Wales | 22% | 22% |
| UK total | 28% | 27% |
Download the data for tables 7 and 8 (ODS, 4KB) or see the Tableau dashboard.