
Introduction
One of the greatest assets we have in the UK is the potential of our diverse talent. Evidence shows that diversity and inclusion can boost business performance, innovation and commercial success. To enable the economy and businesses to grow, we must unlock the power of innovation talent and skills throughout society and in every part of the UK.
Innovate UK is dedicated to creating an inclusive innovation ecosystem, however we cannot achieve this alone. It needs the support of industry, academia and our partners to ensure access and opportunity for as many innovators and great ideas as possible. To achieve our full potential, the UK needs nearly 400,000 more innovators, from entrepreneurs to engineers, and everything in between. These innovators will drive the UK’s future productivity and prosperity.
Innovate UK aims to reach as many businesses as possible across the UK, helping them leverage innovation to boost growth and productivity. We are committed to making our application processes more accessible. This includes making reasonable adjustments, for people who have a disability or a long-term condition and face barriers applying to us. In addition to a wide range of accessible funding and support, we provide targeted programmes, such as Women in Innovation and Young Innovators.
Understanding the demographics of those applying for Innovate UK opportunities is crucial to establish a robust baseline, identify opportunities for change and to be able to track changes in the future. This report details diversity data on age, conditions, illnesses and disabilities, ethnicity and gender for Innovate UK funding applicants, and our plans to progress opportunities for all.
The report draws on data from over 4,400 applications submitted to Innovate UK between March 2022 and March 2023.
To avoid potential data bias, targeted programmes including Women in Innovation and Young Innovators have been excluded from most figures in this report, as these initiatives are aimed at specific demographics. It provides information on those who apply for grant funding, termed ‘applicants’, and those to whom it is awarded, termed ‘funding recipients’. A proportion of respondents chose ‘prefer not to say’ in their responses to the questions, which we have included as a distinct category in this report. Details of the methodology are available in the Annex.
Age
Figure 1: percentage of Innovate UK applicants by age group.
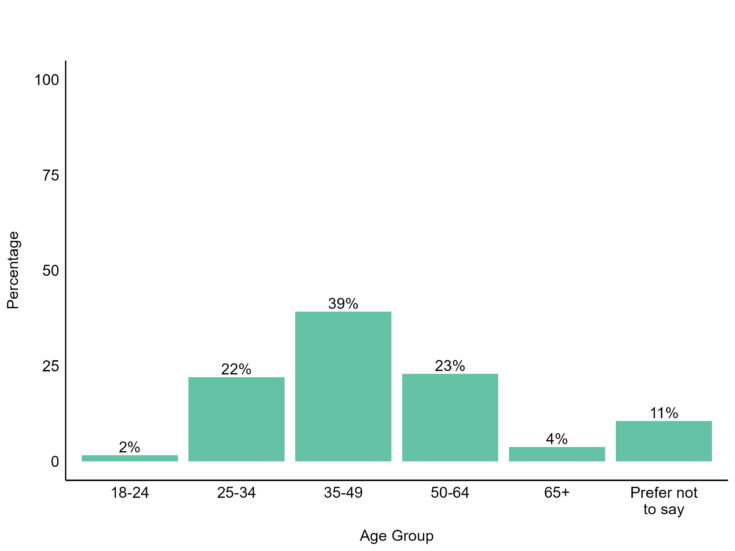
The graph shows that 2% of Innovate UK applicants are aged 18 to 24, 22% are aged 25 to 34, 39% are aged 35 to 49, 23% are aged 50 to 64, 4% are aged 65 and over, and 11% preferred not to say.
Figure 2: percentages of Innovate UK funding recipients by age group.
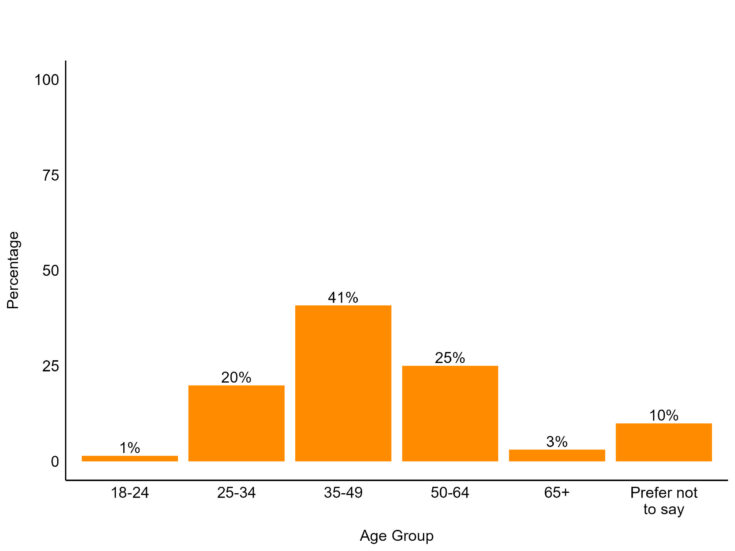
In terms of Innovate UK funding recipients, 1% are aged 18 to 24, 20% are aged 25 to 34, 41% are aged 35 to 49, 25% are aged 50 to 64, 3% are aged 65 and over, and 10% preferred not to say.
We observe a smaller proportion of young people aged 18 to 34 applying for and winning Innovate UK funding, compared to the overall UK workforce. People aged 18 to 34 make up 36% of the UK workforce, while 24%, just under a quarter, of Innovate UK applications were submitted by this age group. This aligns with previous studies which found that the average age of research and development workers is 40.8 and the average age of successful entrepreneurs is 45.
One of our goals is to inspire and support young people to pursue an innovation career path. The UK needs more innovators, and we are dedicated to fostering a robust pipeline of innovation skills and talent. To achieve this, Innovate UK offers the Young Innovators programme, designed to encourage young people to embark on their innovation journey and transform their ideas into reality. The Knowledge Transfer Partnerships also offers graduates the opportunity to fast-track their career, by participating in a unique three-way collaboration with a university and an innovating business.
Conditions, illnesses or disabilities
Figure 3: percentage of Innovate UK applicants who self-identify as having any conditions, illnesses or disabilities that act as a substantial or long-term barrier to carrying out day-to-day activities.
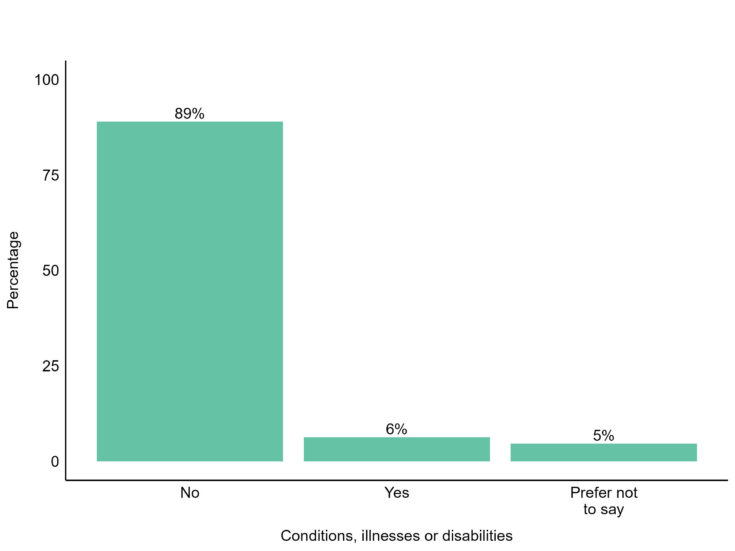
The data reveals that 6% of applicants said they consider themselves to have one or more conditions, illnesses or disabilities, 89% of applicants said they do not consider themselves to have any conditions, illnesses or disabilities, and 5% preferred not to say.
Figure 4: percentage of Innovate UK funding recipients who self-identify as having one or more conditions, illnesses or disabilities that acts as a substantial or long-term barrier to carrying out day-to-day activities.
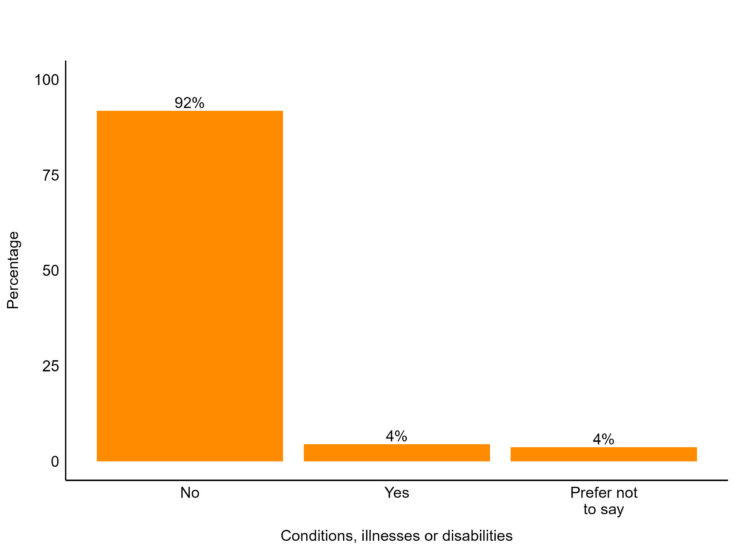
The distribution of funding recipients by conditions, illnesses or disabilities shows that 4% of funded applicants said they have one or more conditions, illnesses or disabilities, 92% said they do not have any conditions, illnesses or disabilities, and 4% preferred not to say.
Evidence shows that disabled people face structural barriers which can limit participation in both the workforce and innovation system.
While 24% of working age adults aged 16 to 64 in the UK have a disability, the 2021 Census showed that non-disabled adults were over twice as likely to be in employment than disabled adults.
It’s crucial that the support we offer is seen as being relevant and accessible to any prospective innovator. As part of our commitment to a more diverse innovation system, in 2022 we introduced a reasonable adjustments process for innovators who face barriers applying to us. To date, this service has supported over 190 applicants.
Innovate UK is encouraging businesses to consider diversity and inclusion in their approach to innovation. The Inclusive Innovation award supported innovations championing accessibility. While the awards supported the development of inclusive innovations, it was encouraging to observe that 22% of Inclusive Innovation funding recipients self-identified as having one or more conditions, illnesses or disabilities.
Ethnicity
Figure 5: Percentage of Innovate UK applicants by ethnicity.
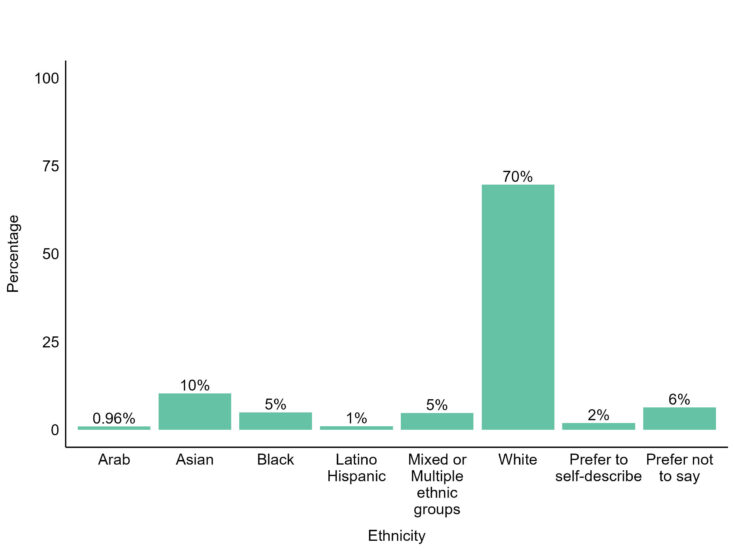
The data shows that 70% of Innovate UK applicants are White, 10% are Asian, 5% are Black, 5% are Mixed or Multiple ethnic groups, 1% are Latino Hispanic, 0.96% are Arab, 2% preferred to self-describe, and 6% preferred not to say.
Figure 6: Percentage of Innovate UK funding recipients by ethnicity.
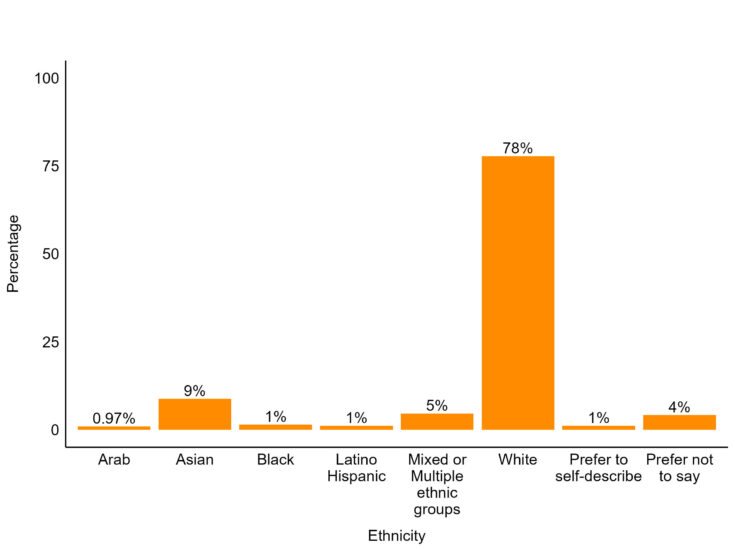
The graph shows that 78%, just over three-quarters, of Innovate UK funding recipients are White, 9% are Asian, 5% are Mixed or Multiple ethnic groups, 1% are Black, 1% are Latino Hispanic, 0.97% Arab, 1% prefer to self-describe, and 4% preferred not to say. When including data from targeted competitions, we observe that just under one in five (19%) of funded applicants are from an ethnic minority background.
According to the 2021 census, 80.7% of the working-age population in England and Wales were White, 10.1% were Asian and 4.4% were Black.
Studies show that ethnic minority groups can face barriers to innovation. For the UK to thrive as an innovation nation, we must unlock the power of innovation talent and skills in every part of the UK and throughout society.
To continue to champion diverse talent in the UK, in 2023 Innovate UK launched Begin and Build, two programmes that are empowering today’s innovators and businesses, increasing investment in diverse talent across the UK.
One of the goals of Begin and Build was to harness innovation talent and skills from all regions of the UK and across all parts of society. It’s encouraging to note that 14% of the funding recipients are Black innovators, and 40% come from ethnic minority backgrounds.
Gender
Figure 7: Percentage of Innovate UK applicants by gender.
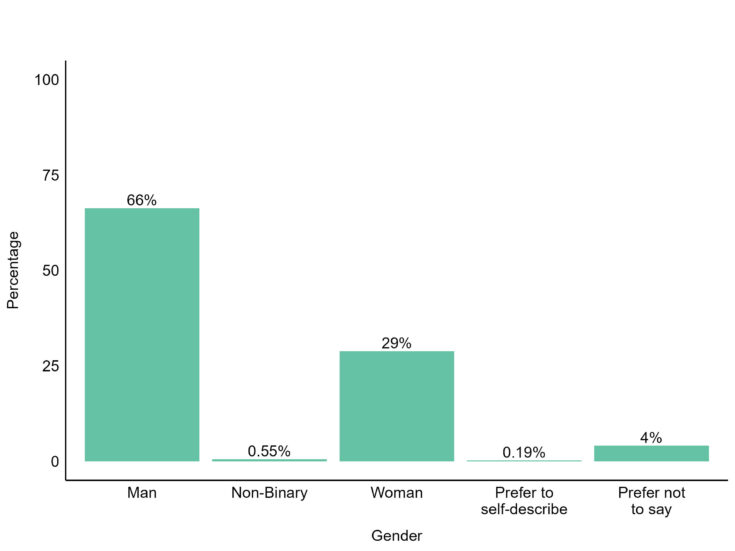
Applications from men accounted for 66% of submissions, with those from women representing 29%. The percentage of applicants identifying as non-binary is 0.55%, 0.19% preferred to self-describe, and 4% preferred not to say.
Figure 8: Percentage of Innovate UK funding recipients by gender.
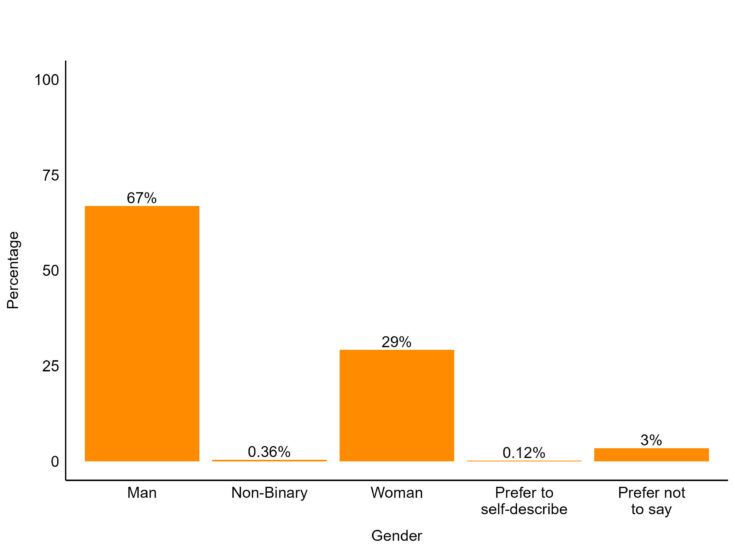
The percentage of funding recipients that disclosed they are men is 67% and the percentage that disclosed they are women is 29%. 0.36% disclosed they are non-binary, 0.12% preferred to self-describe, and 3% preferred not to say’.
The proportion of women funded by Innovate UK is similar to proportion of women in the wider research and innovation workforce (27%). However, women make up almost half (47%) of the UK workforce, which highlights opportunities to address the gender diversity of both Innovate UK applicants and the research and innovation workforce as a whole.
Over the last eight years, we have championed women entrepreneurship and supported opportunities for growth, while inspiring more women into innovation via initiatives including the Women In Innovation awards. Including targeted programmes in the data raises the percentage of women funding recipients to 33%, or one in three, compared to one in seven in 2016.
Our commitment: a more diverse and inclusive innovation system
Innovate UK’s Plan for action for UK business innovation highlights that equality, diversity and inclusion are fundamental for business innovation to succeed. We know the UK needs more innovators, from entrepreneurs to engineers, to fuel future productivity and prosperity.
We are taking action to support more innovators to turn their ideas into reality.
We are transforming the talent and skills pipeline for innovation by making it easy to find relevant opportunities and navigate pathways to success in innovation offered by a wide range of UK organisations.
Working with partners from across the country, in spring 2024, Innovate UK launched No Limits. The digital platform simplifies the search for relevant opportunities and guides pathways to success in innovation offered by partner organisations, from skills and training to investment and advice.
We are committed to ensuring that our funding and support is accessible to all prospective innovators. We iteratively review and update our application and award process to foster inclusion at every stage. For example, a reasonable adjustments process was introduced in 2022 and supported 120 plus applicants in the first 12 months, achieving a 90% recommendation rate.
We are working across Innovate UK to improve consideration of equality, diversity and inclusion from the outset in all of the funding and support we offer. As part of this endeavour, we are also actively encouraging businesses to foster inclusion in their approach to innovation through the Inclusive Innovation award and sector-specific opportunities, such as accessible solutions for disrupted journeys.
One way to foster a more diverse and inclusive innovation system is to run targeted programmes to unlock the power of innovation skills and talent in every part of the UK. To date, our programmes have included Women in Innovation, Young Innovators, Begin and Build.
Targeted programmes are an entry point into wider ecosystem support, with grant holders building networks and connections through engagement with Innovate UK Business Connect and Innovate UK Business Growth. In addition, many grant holders have subsequently secured additional funding grants through other Innovate UK programmes.
We are continuing to build our understanding of innovators, to enable more innovators to reach their potential. The Equality, Diversity and Inclusion Caucus, which is co-funded by Innovate UK, UK Research and Innovation research councils and the British Academy, will provide high-quality research evidence on diversity and inclusion that informs policy and practice across the research and innovation system.
We have also commissioned research through the Innovation and Research Caucus and other partners to help us understand the barriers to innovation faced by specific groups, and explore new ways to overcome them.
Of paramount importance is the need to continue collecting data to drive evidence-based decisions. Practitioners recognise the challenges of collecting diversity data, yet we are encouraged by the proportion of applicants choosing to disclose their personal characteristics when applying to Innovate UK. Robust, reliable data has allowed us to establish a baseline, enabling us to track changes with confidence moving forward.
By publishing our diversity data, we hope to support others across the innovation ecosystem to do the same. This will facilitate a consistent data approach that will enable greater understanding of the innovation ecosystem.
It is our intention to publish regular diversity data reports. This will help to show where progress is being made and provide transparency on further opportunities to meet Innovate UK’s commitment to foster inclusivity and fairness.
Annex
Methodology and technical notes
The data analysed in this report is collected from the lead applicant on submission of an application to Innovate UK. We report on data relating to four characteristics:
- age
- conditions, illnesses or disabilities
- ethnicity
- gender
Within each characteristic we look at who applied for funding, ‘applicants’, as well as the result of their application, ‘funding recipients’.
This report covers diversity data collected on Innovate UK’s funding application platform, the Innovation Funding Service (IFS), between May 2022 and March 2023, reflecting the period when reliable diversity data became available. This report looks at data submitted from over 4,400 applications submitted during this period, covering 78 competitions.
Proportions are calculated based on unrounded numbers and rounded to the nearest 1%, except for if the proportion is less than 1% where the figure is rounded to the nearest two decimal places. Percentages may not total exactly 100% due to rounding.
A proportion of respondents chose ‘prefer not to say’ in their responses to questions. These are acknowledged in the descriptive statistics.
Considerations and exclusions
An applicant’s diversity data is represented in the data each time they apply. This means that if multiple applications are submitted by the same lead project contact, they will appear more than once in the data.
The data presented is on the lead applicant, meaning the individual who submits an application. We do not currently collect data on the role of this individual within the business. Partners and collaborators are excluded from the analysis.
As this report is investigating whether an applicant goes on to be successfully funded, we only consider applications that were subject to the assessment process. This covers most Innovate UK competitions during the financial year 2022 to 2023. However, there are some, such as expression of interest applications, that did not result in a funding decision and are therefore omitted from the data.
Other exclusions within the data include:
- applications to any programmes that did not use IFS
- any competition which did not hold its funding decision meeting within the specified financial year of 2022/2023
- any competitions built in IFS before the introduction of the survey
- Innovation Loans data, as diversity data is not collected through the same process
- applications relating to Horizon Europe Guarantee funding, as the funding decision had been pre-approved prior to using IFS
- targeted programmes including Young Innovators, Women In Innovation and Young Innovators Next Steps, to remove potential data bias due to these programmes being open to a specific demographic
Wherever possible, we have referenced additional data sources to provide context for our results, including the UK Working Age statistics, UK Labour Force statistics and Research and Innovation workforce statistics. While not offering an exact ‘like for like’ comparison with our diversity data, these additional data sources contribute to a broader understanding of the environment in which Innovate UK applicants and funding recipients operate.
Description of variables
Age
Applicants are asked the following: What is your date of birth?
Results are based on the applicant’s date of birth and the date of competition close. They are presented as:
- 18-24
- 25-34
- 35-49
- 50-64
- 65+
- Prefer not to say
Innovate UK applicants must be 18 years old or over to apply for support.
Condition, illness or disability
Applicants are asked the following: Do you consider yourself to have any conditions, illnesses or disabilities that act as a substantial or long-term barrier to carrying out day-to-day activities?
Applicants are provided with the following guidance: A ‘substantial or long-term barrier’ is legally defined as ‘12 months or more’. Day-to-day activities could include travelling for work, using computers, stakeholder interactions, time management, or other relevant activities. The conditions, illnesses or disabilities do not need to be medically diagnosed.
Responses are presented as:
- Yes
- No
- Prefer not to say
Respondents may choose to provide additional details about any conditions, illnesses or disabilities if they wish.
Ethnicity
Applicants are asked the following: What is your ethnicity or ethnic group?
Applicants are provided with the following guidance: Your ethnic group could be your cultural or family background and should be the option you most closely identify with.
Responses are presented as follows:
- Asian Black
- Latino Hispanic
- Mixed or Multiple Ethnic groups
- White
- Prefer to self-describe
- Prefer not to say
Respondents may choose to provide additional details about their ethnic background within each group, if they wish.
Gender
Applicants are asked the following: What is your gender?
Applicants are provided with the following guidance: For this question you are asked about your gender, which may reflect a combination of gender identity, expression or experience. Gender refers to your current gender, which may be different to sex recorded at birth and may be different to what is indicated on legal documents.
Responses are presented as:
- Man
- Non-binary
- Woman
- Prefer to self-describe
- Prefer not to say
- Prefer to self-describe and prefer not to say
Prefer to self-describe and prefer not to say
‘Prefer to self-describe’ refers to when respondents have chosen to input their own response as free text.
‘Prefer not to say’ refers to when respondents have chosen to not disclose their personal information and selected the ‘prefer not to say’ option. Participants who chose ‘Prefer not to say’ were divided across the four characteristics as follows:
- Age 11%
- Conditions, illnesses or disabilities 5%
- Ethnicity 6%
- Gender 4%
Contact us about diversity data
For further information about this data please contact:
Email: support@iuk.ukri.org