
A Natural Environment Research Council (NERC) COVID-19 public engagement funded project has produced infographics to show changes in the movement of people, air and noise pollution, and wildlife sightings in the UK during lockdown.
The Natural History Museum has collaborated with data visualisation company Beyond Words to illustrate some of the environmental changes wrought by lockdown.
The graphics, drawing on a variety of open source data and scientific databases, including data from NERC-supported centres – UK Centre for Ecology & Hydrology (UKCEH) and the British Geological Survey, document the dramatic drop in driving and public transport use, the resulting reduction in air pollution and noise levels and the changes to sightings of both animals and birds.
The release of these graphics is part of Nature in Lockdown, a Natural History Museum public engagement initiative which is seeking to crowdsource research ideas and discover the environmental impacts of COVID-19 which people are most interested in.
The project culminates in a live interactive virtual ‘Lates’ event on Friday 25 September at 19:30 in which audiences can pose questions to young and emerging researchers about those topics.
The Natural History Museum’s Executive Director of Engagement, Clare Matterson, says:
These fascinating visualisations, the result of a collaboration between scientists, our digital teams and Beyond Words, bring to life some of the astonishing impacts lockdown has had on our environments and how we noticed and experienced nature in a new and different way.
Animal sightings
In the first 100 days of lockdown, there were nearly half a million wildlife sightings submitted to wildlife spotting website iRecord, an increase of 54% compared to the same period last year.
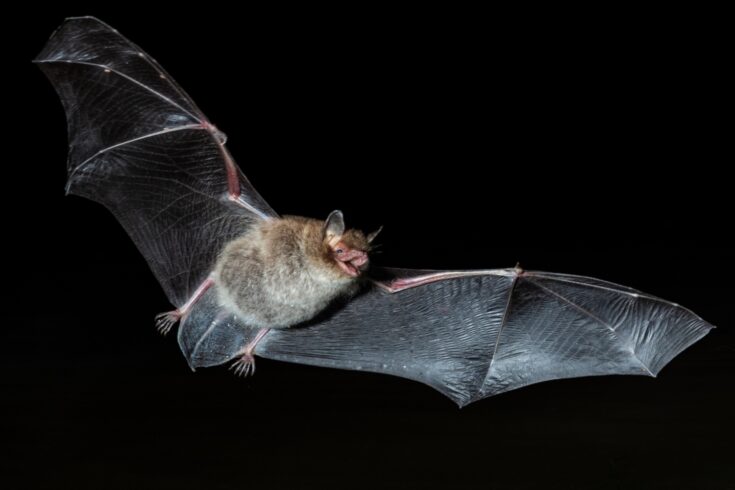
Bat sightings soared the most, with 2.4 times as many bats seen in lockdown as the same time last year.
The most popular lockdown animals were butterflies (129,000 sightings) and moths (90,000 sightings).

David Roy, Head of UKCEH’s Biological Records Centre said:
We saw a clear increase in wildlife sightings during the lockdown period, as people enjoyed the sunny weather and had more time to notice wildlife and connect with nature.
This data is incredibly valuable for researchers to better understand how animal and plant species are faring across the UK.
Bird sightings


Like animal sightings, those of birds were linked to an increase in time spent in gardens and parks versus nature reserves, many of which were shut.
Sightings of our favourite garden birds, the humble house sparrow, starling and collared dove increased whilst sightings of birds that thrive in wetlands such as avocets and marsh harriers plummeted.
Cleaner air
Lockdown and the dramatic decline in journeys in London meant everyone could breathe easier. The graphic below depicts the average carbon dioxide (CO2) emissions measured from the capital’s BT Tower in 2020 versus a 2011-2019 baseline.
The sky-high observatory on top of the iconic BT tower in central London found that CO2 emissions dropped by 60% during lockdown.

Dr Carole Helfter, environmental physicist at UKCEH said:
Lockdown measures in the UK and around the globe have demonstrated that air quality can improve rapidly.
It’s important to recognise that greenhouse gases are long-lived, but the lessons learnt from the COVID-19 pandemic can help shape future emission mitigation strategies.
Noise reductions

Seismologists measuring the UK’s vibrations to monitor sound levels detected up to a 50% drop in the first three weeks of lockdown. The image below maps the higher number of sensor locations which became quieter versus those which became noisier. As animals of all kinds are acutely sensitive to noise pollution – affecting behaviour, stress and even growth, the decrease has been good news for the natural world.
For humans, it led to a rediscovery for many of the joys of hearing birdsong. People in cities across the world felt as though the birds were singing louder. In fact, with competing urban noise down by five decibels (60% quieter)1, the birds were probably actually singing quieter2.
Dr Brian Baptie, seismologist at BGS said:
We see that some of the biggest noise reductions are at sites closest to sources of human-generated noise.
If this were to become the new normal, we might be able to put sensors in places where we’ve never been able to put them before. Much of our understanding about the Earth comes from observations of earthquakes. So in theory, this could lead to new insights about our planet.
Transport changes
Across the UK, public transport journeys dropped by a staggering 82% in the first month of lockdown3. Meaning, we were spending nine times as much time at home4.
When we did venture out, we did so very differently. As cars and public transport were restricted, traffic went quiet. The roads emptied. Overall traffic hit its lowest point on 12 April, with an 81% drop in driving and public transport5.

Duncan Swain, Partner and Creative Director, Beyond Words says:
Data visualisation is a powerful tool for getting to the heart of what’s happening. Collaborating with the Natural History Museum and their partners gave us a unique opportunity to show just how powerful an effect the pandemic has had on the world around us. The results, I think, have opened our eyes to otherwise unseen consequences.
Further information
To find our more visit the Natural History Museum.
Sources
- The Quiet Project via The Guardian.
- Henrik Brumm, research group for the communication and social behavior of birds, Max Planck Institute for Ornithology via DW.
- Apple Mobility Data (accessed 28/7).
- Google Mobility Data, accessed 15/06/20.
- Apple Mobility Data (accessed 28/7), compared to 13 January baseline.